A newspaper published an article about a study in which researchers subjected laboratory gloves to stress. Among 250 vinyl gloves, 56% leaked viruses. Among 250 latex gloves, 6% leaked viruses. Using the accompanying display of the technology results, and using a 0.01 significance level, test the claim that vinyl gloves have a greater virus leak rate than latex gloves. Let vinyl gloves be population 1 A Click the icon to view the technology results O A. Ho P1- P2 O B. Ho P, + P2 H: P P2 OE. H P, P2 OC. Hg P=P2 H P, P2 O D. Ho P1
A newspaper published an article about a study in which researchers subjected laboratory gloves to stress. Among 250 vinyl gloves, 56% leaked viruses. Among 250 latex gloves, 6% leaked viruses. Using the accompanying display of the technology results, and using a 0.01 significance level, test the claim that vinyl gloves have a greater virus leak rate than latex gloves. Let vinyl gloves be population 1 A Click the icon to view the technology results O A. Ho P1- P2 O B. Ho P, + P2 H: P P2 OE. H P, P2 OC. Hg P=P2 H P, P2 O D. Ho P1

Glencoe Algebra 1, Student Edition, 9780079039897, 0079039898, 2018
18th Edition
ISBN:9780079039897
Author:Carter
Publisher:Carter
Chapter4: Equations Of Linear Functions
Section: Chapter Questions
Problem 8SGR

Related questions
Question
Help please
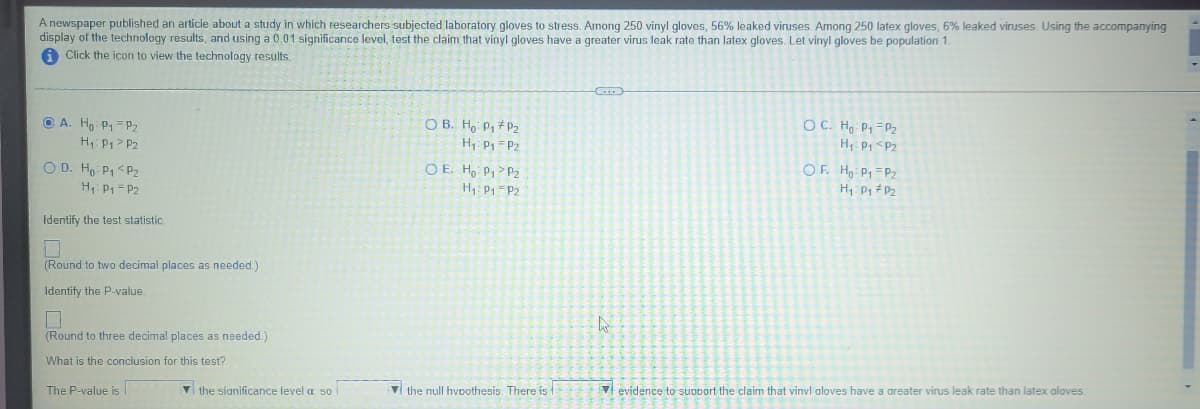
Transcribed Image Text:A newspaper published an article about a study in which researchers subjected laboratory gloves to stress. Among 250 vinyl gloves, 56% leaked viruses. Among 250 latex gloves, 6% leaked viruses. Using the accompanying
display of the technology results, and using a 0.01 significance level, test the claim that vinyl gloves have a greater virus leak rate than latex gloves. Let vinyl gloves be population 1.
Click the icon to view the technology results.
O A. Ho P,=P2
H P1> P2
O B. Ho P, #P2
OC. Hg P, =P2
H: Pp =Pz
H: Pp <Pz
O D. Ho: P1< P2
H P1 = P2
OE. Ho P1> P2
H1: P1-P2
OF. H Pq =Pz
Identify the test statistic
(Round to two decimal places as needed.)
Identify the P-value.
(Round to three decimal places as needed.)
What is the conclusion for this test?
The P-value is
V the sianificance level a. so |
V the null hvoothesis. There is
V evidence to support the claim that vinvl aloves have a areater virus leak rate than latex aloves.
Expert Solution
This question has been solved!
Explore an expertly crafted, step-by-step solution for a thorough understanding of key concepts.

This is a popular solution!

Trending now
This is a popular solution!

Step by step
Solved in 2 steps with 1 images

Recommended textbooks for you
Glencoe Algebra 1, Student Edition, 9780079039897…
Algebra
ISBN:
9780079039897
Author:
Carter
Publisher:
McGraw Hill

College Algebra (MindTap Course List)
Algebra
ISBN:
9781305652231
Author:
R. David Gustafson, Jeff Hughes
Publisher:
Cengage Learning
Glencoe Algebra 1, Student Edition, 9780079039897…
Algebra
ISBN:
9780079039897
Author:
Carter
Publisher:
McGraw Hill
College Algebra (MindTap Course List)
Algebra
ISBN:
9781305652231
Author:
R. David Gustafson, Jeff Hughes
Publisher:
Cengage Learning