A newspaper reported the top five states for sales of hybrid cars in 2004 as California, Virginia, Washington, Florida, and Maryland. Suppose that each car in a sample of 2004 hybrid car sales is classified by state where the sale took place. Sales from states other than the top five were excluded from the sample, resulting in the accompanying table. State Observed Frequency California 248 Virginia 61 Washington 35 Florida 32 Maryland 32 Total 408 (The given observed counts are artificial, but they are consistent with hybrid sales figures given in the article.) The 2004 population estimates from the Census Bureau website are given in the accompanying table. The population proportion for each state was computed by dividing each state population by the total population for all five states. Use the x² goodness-of-fit test and a significance level of a = 0.01 to test the hypothesis that hybrid sales for these five states are proportional to the 2004 population for these states. State 2004 Population Population Proportion California 35,842,038 0.495 Virginia 7,481,332 0.103 Washington 6,207,046 0.085 Florida 17,385,430 0.240 Maryland 5,561,332 0.077 Total 72,477,178 Calculate the test statistic. (Round your answer to two decimal places.) x² = what is the Prvalue for the test? (Use technology to calculate the Pvalue. Round your answer to three decimal places.) Pvalue What can you conclude? O Fail to reject Hg. There is not enough evidence to conclude that hybrid sales are not proportional to population size for the five states listed. O Reject Hg. There is convincing evidence to conclude that hybrid sales are not proportional to population size for the five states listed. O Fail to reject Hg. There is convincing evidence to conclude that hybrid sales are not proportional to population size for the five states listed. O Reject Hg. There is not enough evidence to conclude that hybrid sales are not proportional to population size for the five states listed.
A newspaper reported the top five states for sales of hybrid cars in 2004 as California, Virginia, Washington, Florida, and Maryland. Suppose that each car in a sample of 2004 hybrid car sales is classified by state where the sale took place. Sales from states other than the top five were excluded from the sample, resulting in the accompanying table. State Observed Frequency California 248 Virginia 61 Washington 35 Florida 32 Maryland 32 Total 408 (The given observed counts are artificial, but they are consistent with hybrid sales figures given in the article.) The 2004 population estimates from the Census Bureau website are given in the accompanying table. The population proportion for each state was computed by dividing each state population by the total population for all five states. Use the x² goodness-of-fit test and a significance level of a = 0.01 to test the hypothesis that hybrid sales for these five states are proportional to the 2004 population for these states. State 2004 Population Population Proportion California 35,842,038 0.495 Virginia 7,481,332 0.103 Washington 6,207,046 0.085 Florida 17,385,430 0.240 Maryland 5,561,332 0.077 Total 72,477,178 Calculate the test statistic. (Round your answer to two decimal places.) x² = what is the Prvalue for the test? (Use technology to calculate the Pvalue. Round your answer to three decimal places.) Pvalue What can you conclude? O Fail to reject Hg. There is not enough evidence to conclude that hybrid sales are not proportional to population size for the five states listed. O Reject Hg. There is convincing evidence to conclude that hybrid sales are not proportional to population size for the five states listed. O Fail to reject Hg. There is convincing evidence to conclude that hybrid sales are not proportional to population size for the five states listed. O Reject Hg. There is not enough evidence to conclude that hybrid sales are not proportional to population size for the five states listed.

Glencoe Algebra 1, Student Edition, 9780079039897, 0079039898, 2018
18th Edition
ISBN:9780079039897
Author:Carter
Publisher:Carter
Chapter10: Statistics
Section10.6: Summarizing Categorical Data
Problem 10CYU

Related questions

Question
100%
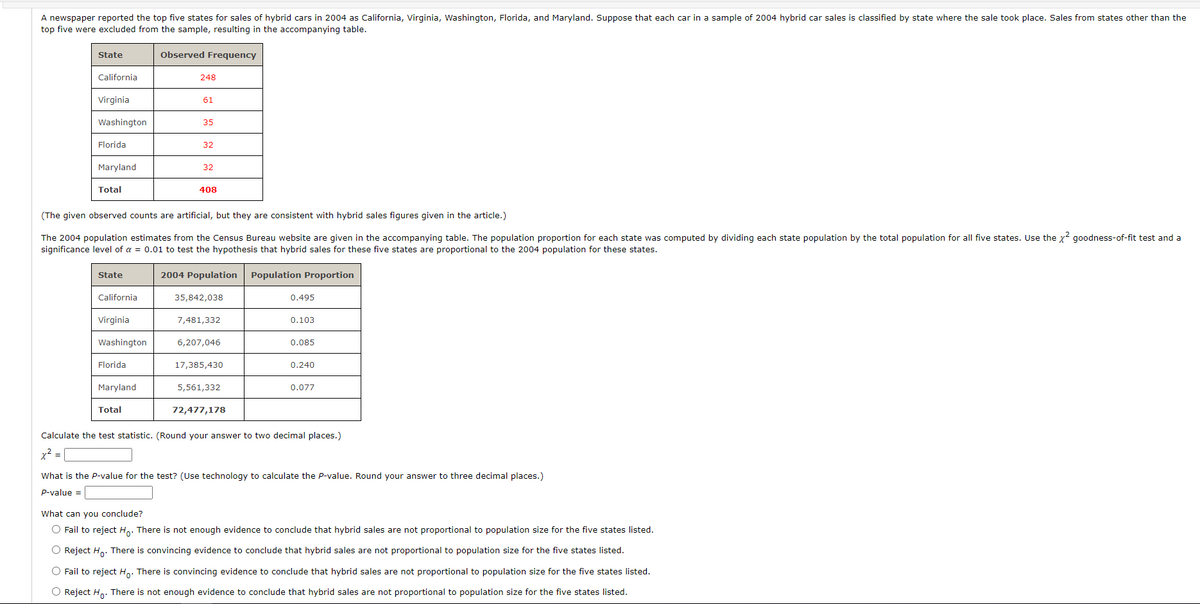
Transcribed Image Text:A newspaper reported the top five states for sales of hybrid cars in 2004 as California, Virginia, Washington, Florida, and Maryland. Suppose that each car in a sample of 2004 hybrid car sales is classified by state where the sale took place. Sales from states other than the
top five were excluded from the sample, resulting in the accompanying table.
State
Observed Frequency
California
248
Virginia
61
Washington
35
Florida
32
Maryland
32
Total
408
(The given observed counts are artificial, but they are consistent with hybrid sales figures given in the article.)
The 2004 population estimates from the Census Bureau website are given in the accompanying table. The population proportion for each state was computed by dividing each state population by the total population for all five states. Use the x2 goodness-of-fit test and a
significance level of a = 0.01 to test the hypothesis that hybrid sales for these five states are proportional to the 2004 population for these states.
State
2004 Population Population Proportion
California
35,842,038
0.495
Virginia
7,481,332
0.103
Washington
6,207,046
0.085
Florida
17,385,430
0.240
Maryland
5,561,332
0.077
Total
72,477,178
Calculate the test statistic. (Round your answer to two decimal places.)
x2 =
What is the P-value for the test? (Use technology to calculate the P-value. Round your answer to three decimal places.)
p-value =
What can you conclude?
O Fail to reject H,. There is not enough evidence to conclude that hybrid sales are not proportional to population size for the five states listed.
O Reject H. There is convincing evidence to conclude that hybrid sales are not proportional to population size for the five states listed.
O Fail to reject H. There is convincing evidence to conclude that hybrid sales are not proportional to population size for the five states listed.
O Reject Ho. There is not enough evidence to conclude that hybrid sales are not proportional to population size for the five states listed.
Expert Solution
This question has been solved!
Explore an expertly crafted, step-by-step solution for a thorough understanding of key concepts.

This is a popular solution!

Trending now
This is a popular solution!

Step by step
Solved in 4 steps with 5 images

Knowledge Booster


Learn more about
Need a deep-dive on the concept behind this application? Look no further. Learn more about this topic, statistics and related others by exploring similar questions and additional content below.Recommended textbooks for you
Glencoe Algebra 1, Student Edition, 9780079039897…
Algebra
ISBN:
9780079039897
Author:
Carter
Publisher:
McGraw Hill

Holt Mcdougal Larson Pre-algebra: Student Edition…
Algebra
ISBN:
9780547587776
Author:
HOLT MCDOUGAL
Publisher:
HOLT MCDOUGAL
Glencoe Algebra 1, Student Edition, 9780079039897…
Algebra
ISBN:
9780079039897
Author:
Carter
Publisher:
McGraw Hill
Holt Mcdougal Larson Pre-algebra: Student Edition…
Algebra
ISBN:
9780547587776
Author:
HOLT MCDOUGAL
Publisher:
HOLT MCDOUGAL