A night fisherman notices that every night, at approximately 23h00, fish suddenly die in the river. The fisherman alerts you that there is a farmer illegally disposing sewage into the river upstream of the spot where the fish die. When you speak to the farmer, he insists that the sewage does not impact the fish because he discharges the sewage every day at 12h00. From further investigation, you find out that the river has a background BOD of 10.7 mg/L. The oxygen deficit just upstream from the farmer's discharge location is 3mg/L. You also find out that the deoxygenation rate coefficient ka is 0.2/day, and the reaeration rate coefficient k, is 0.6/day. a) Determine if the farmer's illegal sewage disposal is the reason the fish die every night by considering the critical point of the oxygen deficit. b) Determine the distance the discharge would need to be to match the critical point where the fish die if the river flow is 25 km/day and using the map below, suggest who the likely polluter could be. No km radius 30 km radius Power Pat 20 km radius fetar 10 km radius Viney Viage Pot where Farm ih e Figure 1: Aerial image of activities upstream of point where fish are found dead. c) Find the minimum DO due to the effluent discharge if the DOan is 12 mg/L. d) Using the Steeter-Phelps sag curve, indicate the key phases on of the BOD in relation to the polluter and the where the fish are impacted. Discuss each phase and provide a potential solution to reduce the impact of the polluter's discharge on the fish species.
A night fisherman notices that every night, at approximately 23h00, fish suddenly die in the river. The fisherman alerts you that there is a farmer illegally disposing sewage into the river upstream of the spot where the fish die. When you speak to the farmer, he insists that the sewage does not impact the fish because he discharges the sewage every day at 12h00. From further investigation, you find out that the river has a background BOD of 10.7 mg/L. The oxygen deficit just upstream from the farmer's discharge location is 3mg/L. You also find out that the deoxygenation rate coefficient ka is 0.2/day, and the reaeration rate coefficient k, is 0.6/day. a) Determine if the farmer's illegal sewage disposal is the reason the fish die every night by considering the critical point of the oxygen deficit. b) Determine the distance the discharge would need to be to match the critical point where the fish die if the river flow is 25 km/day and using the map below, suggest who the likely polluter could be. No km radius 30 km radius Power Pat 20 km radius fetar 10 km radius Viney Viage Pot where Farm ih e Figure 1: Aerial image of activities upstream of point where fish are found dead. c) Find the minimum DO due to the effluent discharge if the DOan is 12 mg/L. d) Using the Steeter-Phelps sag curve, indicate the key phases on of the BOD in relation to the polluter and the where the fish are impacted. Discuss each phase and provide a potential solution to reduce the impact of the polluter's discharge on the fish species.

Solid Waste Engineering
3rd Edition
ISBN:9781305635203
Author:Worrell, William A.
Publisher:Worrell, William A.
Chapter3: Collection
Section: Chapter Questions
Problem 3.7P

Related questions

Question
Transcribed Image Text:A night fisherman notices that every night, at approximately 23h00, fish suddenly die in the river. The fisherman alerts you that
there is a farmer illegally disposing sewage into the river upstream of the spot where the fish die. When you speak to the
farmer, he insists that the sewage does not impact the fish because he discharges the sewage every day at 12h00.
From further investigation, you find out that the river has a background BOD of 10.7 mg/L. The oxygen deficit just upstream
from the farmer's discharge location is 3mg/L. You also find out that the deoxygenation rate coefficient ka is 0.2/day, and the
reaeration rate coefficient k, is 0.6/day.
a) Determine if the farmer's illegal sewage disposal is the reason the fish die every night by considering the critical point
of the oxygen deficit.
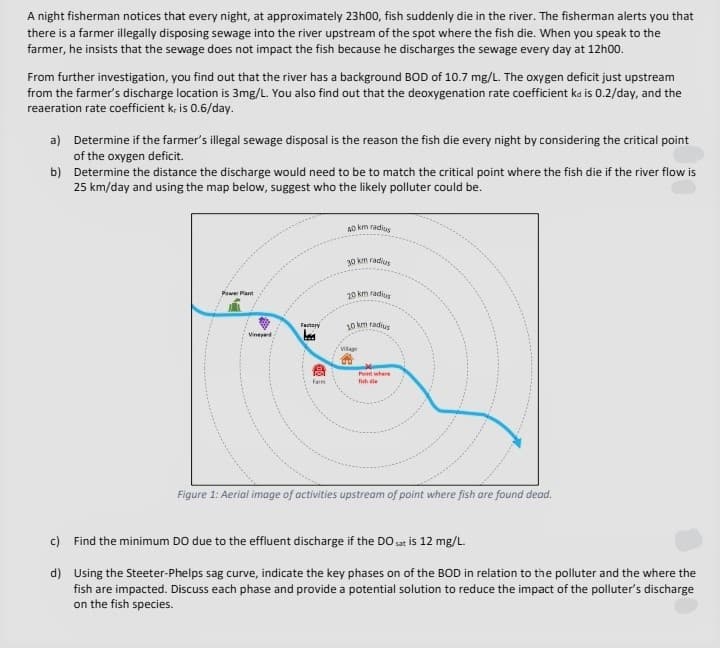
b) Determine the distance the discharge would need to be to match the critical point where the fish die if the river flow is
25 km/day and using the map below, suggest who the likely polluter could be.
Ao km radius
30 km radius
Power Plant
20 km radius
Factory
10 km radius
Vineyad
Vilage
Pont where
Farm
fsh die
Figure 1: Aerial image of activities upstream of point where fish are found dead.
c) Find the minimum DO due to the effluent discharge if the DO is 12 mg/L.
d) Using the Steeter-Phelps sag curve, indicate the key phases on of the BOD in relation to the polluter and the where the
fish are impacted. Discuss each phase and provide a potential solution to reduce the impact of the polluter's discharge
on the fish species.
Expert Solution
This question has been solved!
Explore an expertly crafted, step-by-step solution for a thorough understanding of key concepts.

Step by step
Solved in 5 steps

Knowledge Booster


Learn more about
Need a deep-dive on the concept behind this application? Look no further. Learn more about this topic, civil-engineering and related others by exploring similar questions and additional content below.Recommended textbooks for you
Solid Waste Engineering
Civil Engineering
ISBN:
9781305635203
Author:
Worrell, William A.
Publisher:
Cengage Learning,
Solid Waste Engineering
Civil Engineering
ISBN:
9781305635203
Author:
Worrell, William A.
Publisher:
Cengage Learning,