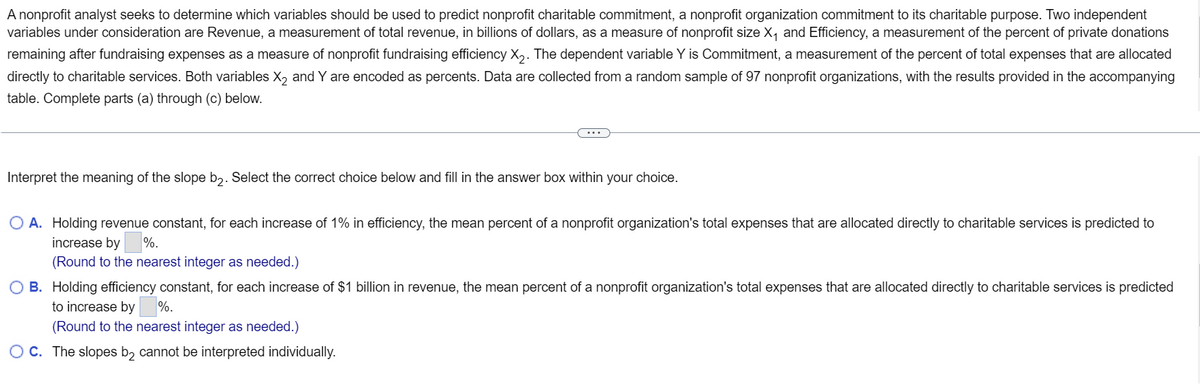
A nonprofit analyst seeks to determine which variables should be used to predict nonprofit charitable commitment, a nonprofit organization commitment to its charitable purpose. Two independent variables under consideration are Revenue, a measurement of total revenue, in billions of dollars, as a measure of nonprofit size X₁ and Efficiency, a measurement of the percent of private donations remaining after fundraising expenses as a measure of nonprofit fundraising efficiency X₂. The dependent variable Y is Commitment, a measurement of the percent of total expenses that are allocated directly to charitable services. Both variables X₂ and Y are encoded as percents. Data are collected from a random sample of 97 nonprofit organizations, with the results provided in the accompanying table. Complete parts (a) through (c) below. Interpret the meaning of the slope b₂. Select the correct choice below and fill in the answer box within your choice. OA. Holding revenue constant, for each increase of 1% in efficiency, the mean percent of a nonprofit organization's total expenses that are allocated directly to charitable services is predicted to increase by %. (Round to the nearest integer as needed.) OB. Holding efficiency constant, for each increase of $1 billion in revenue, the mean percent of a nonprofit organization's total expenses that are allocated directly to charitable services is predicted to increase by %. (Round to the nearest integer as needed.) OC. The slopes b₂ cannot be interpreted individually.
A nonprofit analyst seeks to determine which variables should be used to predict nonprofit charitable commitment, a nonprofit organization commitment to its charitable purpose. Two independent variables under consideration are Revenue, a measurement of total revenue, in billions of dollars, as a measure of nonprofit size X₁ and Efficiency, a measurement of the percent of private donations remaining after fundraising expenses as a measure of nonprofit fundraising efficiency X₂. The dependent variable Y is Commitment, a measurement of the percent of total expenses that are allocated directly to charitable services. Both variables X₂ and Y are encoded as percents. Data are collected from a random sample of 97 nonprofit organizations, with the results provided in the accompanying table. Complete parts (a) through (c) below. Interpret the meaning of the slope b₂. Select the correct choice below and fill in the answer box within your choice. OA. Holding revenue constant, for each increase of 1% in efficiency, the mean percent of a nonprofit organization's total expenses that are allocated directly to charitable services is predicted to increase by %. (Round to the nearest integer as needed.) OB. Holding efficiency constant, for each increase of $1 billion in revenue, the mean percent of a nonprofit organization's total expenses that are allocated directly to charitable services is predicted to increase by %. (Round to the nearest integer as needed.) OC. The slopes b₂ cannot be interpreted individually.

MATLAB: An Introduction with Applications
6th Edition
ISBN:9781119256830
Author:Amos Gilat
Publisher:Amos Gilat
Chapter1: Starting With Matlab
Section: Chapter Questions
Problem 1P

Related questions
Question
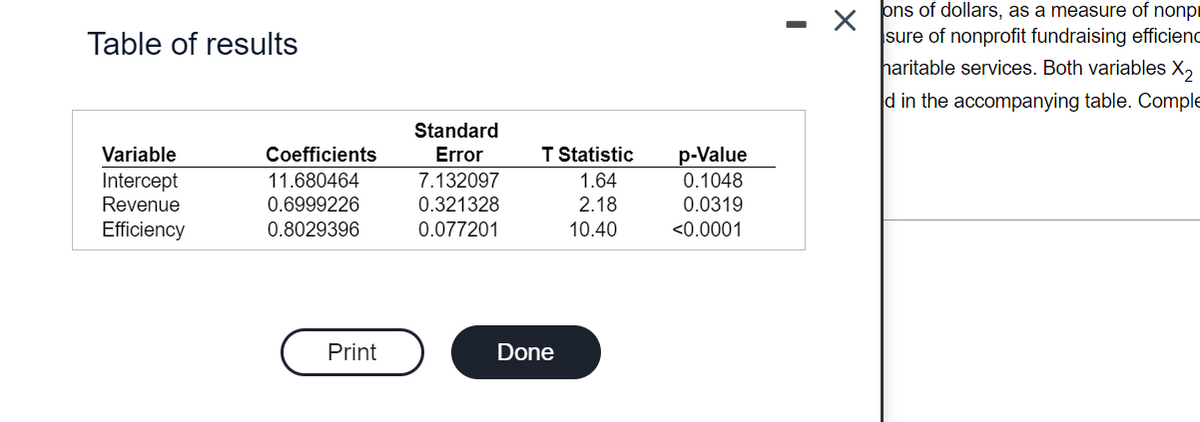
Transcribed Image Text:Table of results
Variable
Intercept
Revenue
Efficiency
Coefficients
11.680464
0.6999226
0.8029396
Print
Standard
Error
7.132097
0.321328
0.077201
T Statistic
1.64
2.18
10.40
Done
p-Value
0.1048
0.0319
<0.0001
X
ons of dollars, as a measure of nonp
sure of nonprofit fundraising efficienc
haritable services. Both variables X₂
d in the accompanying table. Comple
Transcribed Image Text:A nonprofit analyst seeks to determine which variables should be used to predict nonprofit charitable commitment, a nonprofit organization commitment to its charitable purpose. Two independent
variables under consideration are Revenue, a measurement of total revenue, in billions of dollars, as a measure of nonprofit size X₁ and Efficiency, a measurement of the percent of private donations
remaining after fundraising expenses as a measure of nonprofit fundraising efficiency X₂. The dependent variable Y is Commitment, a measurement of the percent of total expenses that are allocated
directly to charitable services. Both variables X₂ and Y are encoded as percents. Data are collected from a random sample of 97 nonprofit organizations, with the results provided in the accompanying
table. Complete parts (a) through (c) below.
Interpret the meaning of the slope b2. Select the correct choice below and fill in the answer box within your choice.
O A. Holding revenue constant, for each increase of 1% in efficiency, the mean percent of a nonprofit organization's total expenses that are allocated directly to charitable services is predicted to
increase by %.
(Round to the nearest integer as needed.)
B. Holding efficiency constant, for each increase of $1 billion in revenue, the mean percent of a nonprofit organization's total expenses that are allocated directly to charitable services is predicted
to increase by %.
(Round to the nearest integer as needed.)
OC. The slopes b₂ cannot be interpreted individually.
Expert Solution
This question has been solved!
Explore an expertly crafted, step-by-step solution for a thorough understanding of key concepts.

This is a popular solution!

Trending now
This is a popular solution!

Step by step
Solved in 2 steps

Recommended textbooks for you
MATLAB: An Introduction with Applications
Statistics
ISBN:
9781119256830
Author:
Amos Gilat
Publisher:
John Wiley & Sons Inc

Probability and Statistics for Engineering and th…
Statistics
ISBN:
9781305251809
Author:
Jay L. Devore
Publisher:
Cengage Learning

Statistics for The Behavioral Sciences (MindTap C…
Statistics
ISBN:
9781305504912
Author:
Frederick J Gravetter, Larry B. Wallnau
Publisher:
Cengage Learning
MATLAB: An Introduction with Applications
Statistics
ISBN:
9781119256830
Author:
Amos Gilat
Publisher:
John Wiley & Sons Inc
Probability and Statistics for Engineering and th…
Statistics
ISBN:
9781305251809
Author:
Jay L. Devore
Publisher:
Cengage Learning
Statistics for The Behavioral Sciences (MindTap C…
Statistics
ISBN:
9781305504912
Author:
Frederick J Gravetter, Larry B. Wallnau
Publisher:
Cengage Learning

Elementary Statistics: Picturing the World (7th E…
Statistics
ISBN:
9780134683416
Author:
Ron Larson, Betsy Farber
Publisher:
PEARSON

The Basic Practice of Statistics
Statistics
ISBN:
9781319042578
Author:
David S. Moore, William I. Notz, Michael A. Fligner
Publisher:
W. H. Freeman

Introduction to the Practice of Statistics
Statistics
ISBN:
9781319013387
Author:
David S. Moore, George P. McCabe, Bruce A. Craig
Publisher:
W. H. Freeman