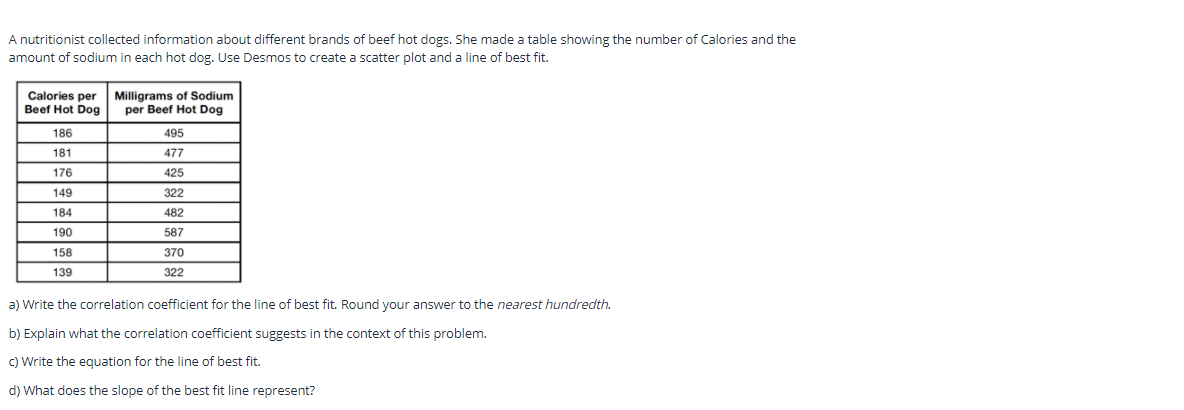
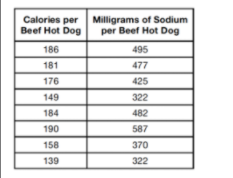
A nutritionist collected information about different brands of beef hot dogs. She made a table showing the number of Calories and the amount of sodium in each hot dog. Use Desmos to create a scatter plot and a line of best fit. Calories per Milligrams of Sodium Beef Hot Dog per Beef Hot Dog 186 495 181 477 176 425 149 322 184 482 190 587 158 370 139 322 a) Write the correlation coefficient for the line of best fit. Round your answer to the nearest hundredth. b) Explain what the correlation coefficient suggests in the context of this problem. C) Write the equation for the line of best fit. d) What does the slope of the best fit line represent?
A nutritionist collected information about different brands of beef hot dogs. She made a table showing the number of Calories and the amount of sodium in each hot dog. Use Desmos to create a scatter plot and a line of best fit. Calories per Milligrams of Sodium Beef Hot Dog per Beef Hot Dog 186 495 181 477 176 425 149 322 184 482 190 587 158 370 139 322 a) Write the correlation coefficient for the line of best fit. Round your answer to the nearest hundredth. b) Explain what the correlation coefficient suggests in the context of this problem. C) Write the equation for the line of best fit. d) What does the slope of the best fit line represent?

Glencoe Algebra 1, Student Edition, 9780079039897, 0079039898, 2018
18th Edition
ISBN:9780079039897
Author:Carter
Publisher:Carter
Chapter10: Statistics
Section10.3: Measures Of Spread
Problem 8PPS

Related questions

Question
Practice Pack
plz help me
Transcribed Image Text:A nutritionist collected information about different brands of beef hot dogs. She made a table showing the number of Calories and the
amount of sodium in each hot dog. Use Desmos to create a scatter plot and a line of best fit.
Calories per
Beef Hot Dog
Milligrams of Sodium
per Beef Hot Dog
186
495
181
477
176
425
149
322
184
482
190
587
158
370
139
322
a) Write the correlation coefficient for the line of best fit. Round your answer to the nearest hundredth.
b) Explain what the correlation coefficient suggests in the context of this problem.
c) Write the equation for the line of best fit.
d) What does the slope of the best fit line represent?
Expert Solution
Step 1
Since you have posted a question with multiple sub-parts, we will solve first three sub-parts for you. To get remaining sub-part solved please repost the complete question and mention the sub-parts to be solved.
Given,
Sample size=n=8.
Better your learning with
Practice Pack
Better your learning with
Practice Pack

Trending now
This is a popular solution!

Learn your way
Includes step-by-step video

Step by step
Solved in 6 steps with 2 images

Knowledge Booster


Learn more about
Need a deep-dive on the concept behind this application? Look no further. Learn more about this topic, statistics and related others by exploring similar questions and additional content below.Recommended textbooks for you
Glencoe Algebra 1, Student Edition, 9780079039897…
Algebra
ISBN:
9780079039897
Author:
Carter
Publisher:
McGraw Hill

Big Ideas Math A Bridge To Success Algebra 1: Stu…
Algebra
ISBN:
9781680331141
Author:
HOUGHTON MIFFLIN HARCOURT
Publisher:
Houghton Mifflin Harcourt

Holt Mcdougal Larson Pre-algebra: Student Edition…
Algebra
ISBN:
9780547587776
Author:
HOLT MCDOUGAL
Publisher:
HOLT MCDOUGAL
Glencoe Algebra 1, Student Edition, 9780079039897…
Algebra
ISBN:
9780079039897
Author:
Carter
Publisher:
McGraw Hill
Big Ideas Math A Bridge To Success Algebra 1: Stu…
Algebra
ISBN:
9781680331141
Author:
HOUGHTON MIFFLIN HARCOURT
Publisher:
Houghton Mifflin Harcourt
Holt Mcdougal Larson Pre-algebra: Student Edition…
Algebra
ISBN:
9780547587776
Author:
HOLT MCDOUGAL
Publisher:
HOLT MCDOUGAL