A paint manufacturer uses a machine to fill gallon cans with paint (1 gal = 128 ounces). The manufacturer wants to estimate the mean volume of paint the machine is putting in the cans within 0.5 ounce. Assume the population volumes is normally distributed. (a) Determine the minimum sample size required to construct a 90% confidence interval for the population mean. Assume the population standard deviation is 0.67 ounce. (b) The sample mean is 128.25 ounces. With a sample size of 7, a 90% level of confidence, and a population standard deviation of 0.67 ounce, does it seem possible that the population mean could be exactly 128 ounces? Ex Click here to view page 1 of the Standard Normal Table. Click here to view page 2 of the Standard Normal Table. (a) The minimum sample size required to construct a 90% confidence interval is cans (Round up to the nearest whole number.) (b) The 90% confidence interval for a sample size of 7 is (.) It V seem possible that the population mean could be exactly 128 ounces because 128 ounces falls V the confidence interval. (Round to two decimal places as needed.)
A paint manufacturer uses a machine to fill gallon cans with paint (1 gal = 128 ounces). The manufacturer wants to estimate the mean volume of paint the machine is putting in the cans within 0.5 ounce. Assume the population volumes is normally distributed. (a) Determine the minimum sample size required to construct a 90% confidence interval for the population mean. Assume the population standard deviation is 0.67 ounce. (b) The sample mean is 128.25 ounces. With a sample size of 7, a 90% level of confidence, and a population standard deviation of 0.67 ounce, does it seem possible that the population mean could be exactly 128 ounces? Ex Click here to view page 1 of the Standard Normal Table. Click here to view page 2 of the Standard Normal Table. (a) The minimum sample size required to construct a 90% confidence interval is cans (Round up to the nearest whole number.) (b) The 90% confidence interval for a sample size of 7 is (.) It V seem possible that the population mean could be exactly 128 ounces because 128 ounces falls V the confidence interval. (Round to two decimal places as needed.)

MATLAB: An Introduction with Applications
6th Edition
ISBN:9781119256830
Author:Amos Gilat
Publisher:Amos Gilat
Chapter1: Starting With Matlab
Section: Chapter Questions
Problem 1P

Related questions

Question
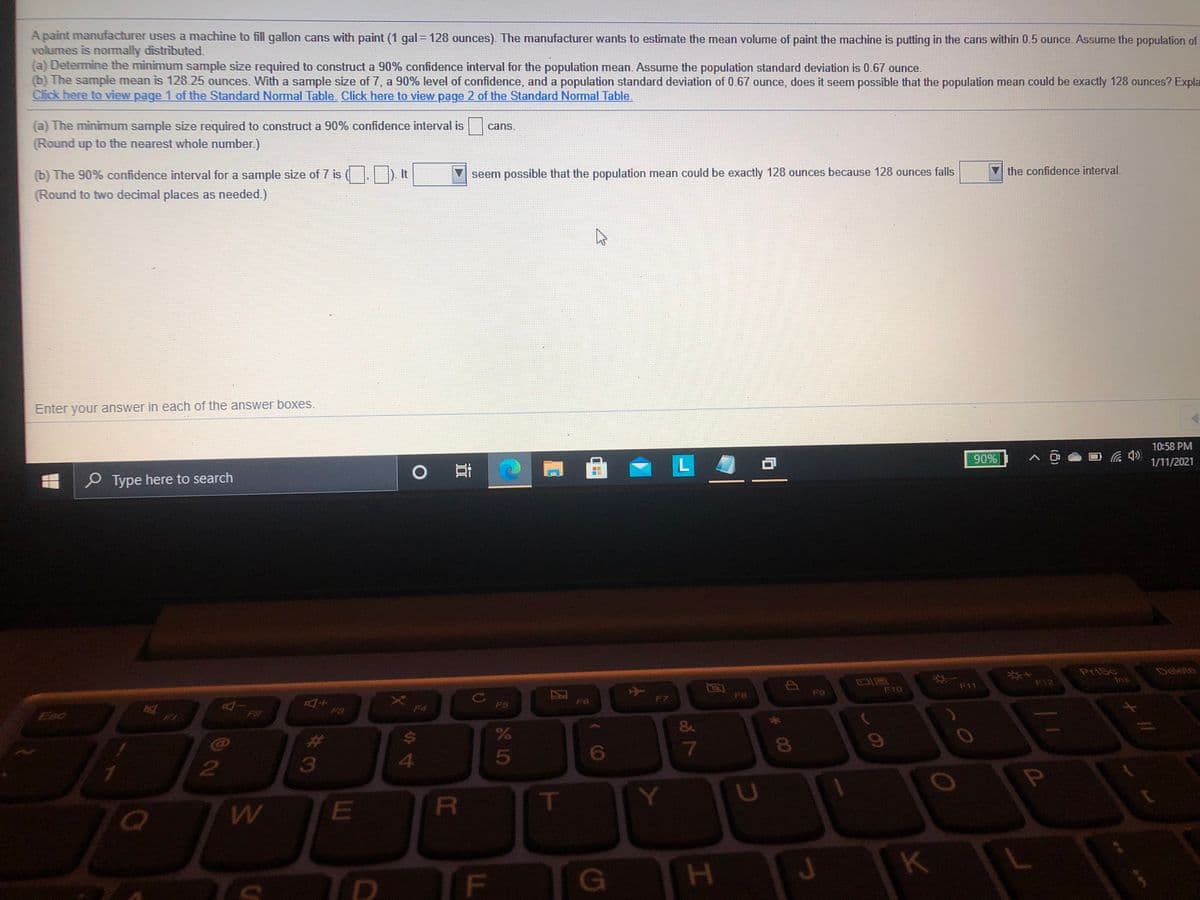
Transcribed Image Text:A paint manufacturer uses a machine to fill gallon cans with paint (1 gal = 128 ounces). The manufacturer wants to estimate the mean volume of paint the machine is putting in the cans within 0.5 ounce. Assume the population of
volumes is normally distributed.
(a) Determine the minimum sample size required to construct a 90% confidence interval for the population mean. Assume the population standard deviation is 0.67 ounce.
(b) The sample mean is 12825 ounces. With a sample size of 7, a 90% level of confidence, and a population standard deviation of 0.67 ounce, does it seem possible that the population mean could be exactly 128 ounces? Expla
Click here to view page 1 of the Standard Normal Table. Click here to view page 2 of the Standard Normal Table.
(a) The minimum sample size required to construct a 90% confidence interval is
cans.
(Round up to the nearest whole number.)
(b) The 90% confidence interval for a sample size of 7 is (.) It
seem possible that the population mean could be exactly 128 ounces because 128 ounces falls
the confidence interval.
(Round to two decimal places as needed.)
Enter your answer in each of the answer boxes.
10:58 PM
90%
1/11/2021
PType here to search
Delete
*4
F12
Ins
F11
FO
F10
F8
F6
F7
F5
F3
F4
Esc
ww
%23
3
4.
5
P
R\
K
# 00
F.
Expert Solution
This question has been solved!
Explore an expertly crafted, step-by-step solution for a thorough understanding of key concepts.

This is a popular solution!

Trending now
This is a popular solution!

Step by step
Solved in 2 steps

Knowledge Booster


Learn more about
Need a deep-dive on the concept behind this application? Look no further. Learn more about this topic, statistics and related others by exploring similar questions and additional content below.Recommended textbooks for you
MATLAB: An Introduction with Applications
Statistics
ISBN:
9781119256830
Author:
Amos Gilat
Publisher:
John Wiley & Sons Inc

Probability and Statistics for Engineering and th…
Statistics
ISBN:
9781305251809
Author:
Jay L. Devore
Publisher:
Cengage Learning

Statistics for The Behavioral Sciences (MindTap C…
Statistics
ISBN:
9781305504912
Author:
Frederick J Gravetter, Larry B. Wallnau
Publisher:
Cengage Learning
MATLAB: An Introduction with Applications
Statistics
ISBN:
9781119256830
Author:
Amos Gilat
Publisher:
John Wiley & Sons Inc
Probability and Statistics for Engineering and th…
Statistics
ISBN:
9781305251809
Author:
Jay L. Devore
Publisher:
Cengage Learning
Statistics for The Behavioral Sciences (MindTap C…
Statistics
ISBN:
9781305504912
Author:
Frederick J Gravetter, Larry B. Wallnau
Publisher:
Cengage Learning

Elementary Statistics: Picturing the World (7th E…
Statistics
ISBN:
9780134683416
Author:
Ron Larson, Betsy Farber
Publisher:
PEARSON

The Basic Practice of Statistics
Statistics
ISBN:
9781319042578
Author:
David S. Moore, William I. Notz, Michael A. Fligner
Publisher:
W. H. Freeman

Introduction to the Practice of Statistics
Statistics
ISBN:
9781319013387
Author:
David S. Moore, George P. McCabe, Bruce A. Craig
Publisher:
W. H. Freeman