A Pareto diagram is a variation of a histogram for categorical data resulting from a quality control study. Each category represents a different type of product nonconformity or production problem. The categories are ordered so that the one with the largest frequency appears on the far left, then the category with the second largest frequency, and so on. Suppose the following information on nonconformities in circuit packs is obtained. failed component (FC), 127; incorrect component (IC), 211; insufficient solder (IS), 68; excess solder (ES), 55; missing component (MC), 130 Construct a Pareto diagram. Count Count Count 200 200 - 200 150- 150- 150- 100 100- 100 50 50 50 IS ES O IC MC FC IS ES FC IC IS IC MC FC ES MC Count 200 150 100 50 ES FC IC IS MC
A Pareto diagram is a variation of a histogram for categorical data resulting from a quality control study. Each category represents a different type of product nonconformity or production problem. The categories are ordered so that the one with the largest frequency appears on the far left, then the category with the second largest frequency, and so on. Suppose the following information on nonconformities in circuit packs is obtained. failed component (FC), 127; incorrect component (IC), 211; insufficient solder (IS), 68; excess solder (ES), 55; missing component (MC), 130 Construct a Pareto diagram. Count Count Count 200 200 - 200 150- 150- 150- 100 100- 100 50 50 50 IS ES O IC MC FC IS ES FC IC IS IC MC FC ES MC Count 200 150 100 50 ES FC IC IS MC

Glencoe Algebra 1, Student Edition, 9780079039897, 0079039898, 2018
18th Edition
ISBN:9780079039897
Author:Carter
Publisher:Carter
Chapter10: Statistics
Section: Chapter Questions
Problem 13PT

Related questions
Question
Q7
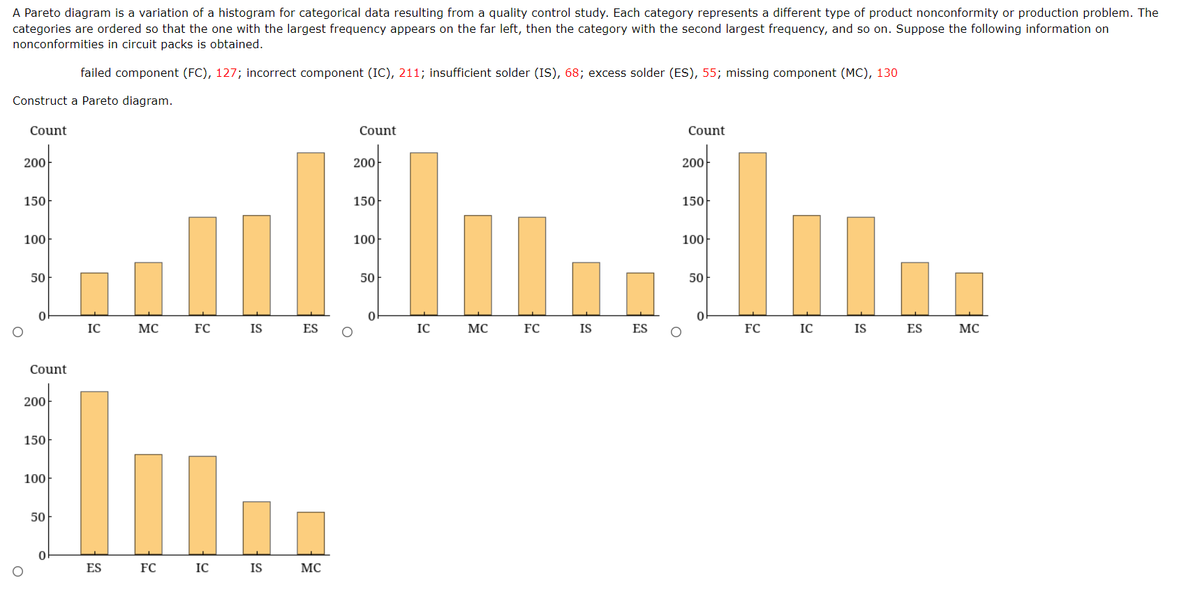
Transcribed Image Text:A Pareto diagram is a variation of a histogram for categorical data resulting from a quality control study. Each category represents a different type of product nonconformity or production problem. The
categories are ordered so that the one with the largest frequency appears on the far left, then the category with the second largest frequency, and so on. Suppose the following information on
nonconformities in circuit packs is obtained.
failed component (FC), 127; incorrect component (IC), 211; insufficient solder (IS), 68; excess solder (ES), 55; missing component (MC), 130
Construct a Pareto diagram.
Count
Count
Count
200
200
200
150
150
150
100
100
100
50
50
50
IC
MC
FC
IS
ES
IC
MC
FC
IS
ES
FC
IC
IS
ES
MC
Count
200
150
100
50
ES
FC
IC
IS
MC
Expert Solution
This question has been solved!
Explore an expertly crafted, step-by-step solution for a thorough understanding of key concepts.

This is a popular solution!

Trending now
This is a popular solution!

Step by step
Solved in 2 steps with 1 images

Recommended textbooks for you
Glencoe Algebra 1, Student Edition, 9780079039897…
Algebra
ISBN:
9780079039897
Author:
Carter
Publisher:
McGraw Hill

Holt Mcdougal Larson Pre-algebra: Student Edition…
Algebra
ISBN:
9780547587776
Author:
HOLT MCDOUGAL
Publisher:
HOLT MCDOUGAL

College Algebra (MindTap Course List)
Algebra
ISBN:
9781305652231
Author:
R. David Gustafson, Jeff Hughes
Publisher:
Cengage Learning
Glencoe Algebra 1, Student Edition, 9780079039897…
Algebra
ISBN:
9780079039897
Author:
Carter
Publisher:
McGraw Hill
Holt Mcdougal Larson Pre-algebra: Student Edition…
Algebra
ISBN:
9780547587776
Author:
HOLT MCDOUGAL
Publisher:
HOLT MCDOUGAL
College Algebra (MindTap Course List)
Algebra
ISBN:
9781305652231
Author:
R. David Gustafson, Jeff Hughes
Publisher:
Cengage Learning
