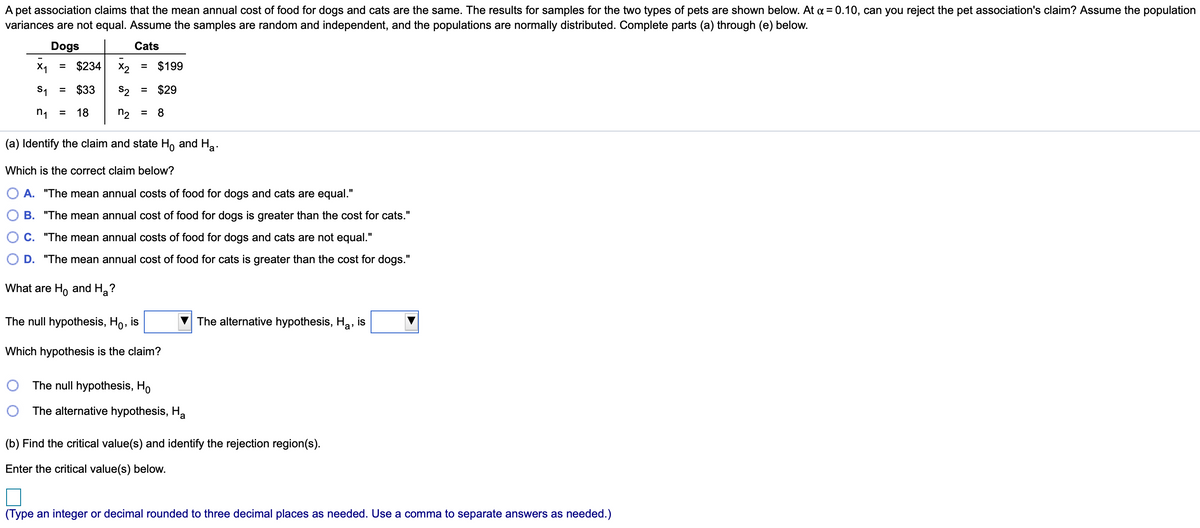
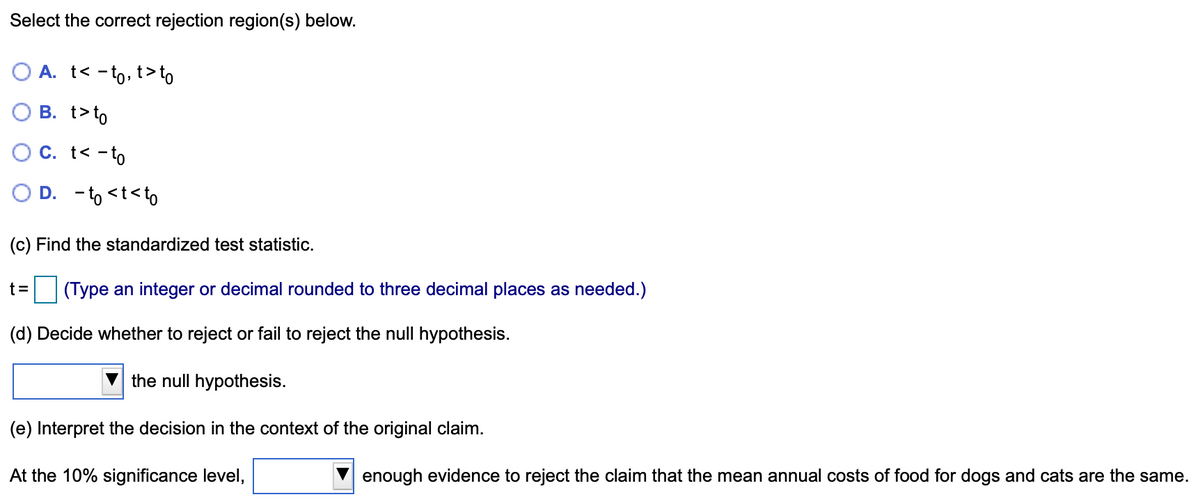
A pet association claims that the mean annual cost of food for dogs and cats are the same. The results for samples for the two types of pets are shown below. At a = 0.10, can you reject the pet association's claim? Assume the population variances are not equal. Assume the samples are random and independent, and the populations are normally distributed. Complete parts (a) through (e) below. Dogs Cats X, = $234 X2 = $199 s, = $33 S2 = $29 n, = 18 n2 = 8 (a) Identify the claim and state Ho and Ha. Which is the correct claim below? O A. "The mean annual costs of food for dogs and cats are equal." O B. "The mean annual cost of food for dogs is greater than the cost for cats." OC. "The mean annual costs of food for dogs and cats are not equal." O D. "The mean annual cost of food for cats is greater than the cost for dogs." What are Ho and H,? The null hypothesis, Ho, is V The alternative hypothesis, Ha, is Which hypothesis is the claim? O The null hypothesis, Ho O The alternative hypothesis, H (b) Find the critical value(s) and identify the rejection region(s). Enter the critical value(s) below.


Continuous Probability Distributions
Probability distributions are of two types, which are continuous probability distributions and discrete probability distributions. A continuous probability distribution contains an infinite number of values. For example, if time is infinite: you could count from 0 to a trillion seconds, billion seconds, so on indefinitely. A discrete probability distribution consists of only a countable set of possible values.
Normal Distribution
Suppose we had to design a bathroom weighing scale, how would we decide what should be the range of the weighing machine? Would we take the highest recorded human weight in history and use that as the upper limit for our weighing scale? This may not be a great idea as the sensitivity of the scale would get reduced if the range is too large. At the same time, if we keep the upper limit too low, it may not be usable for a large percentage of the population!


Trending now
This is a popular solution!

Step by step
Solved in 5 steps with 1 images


