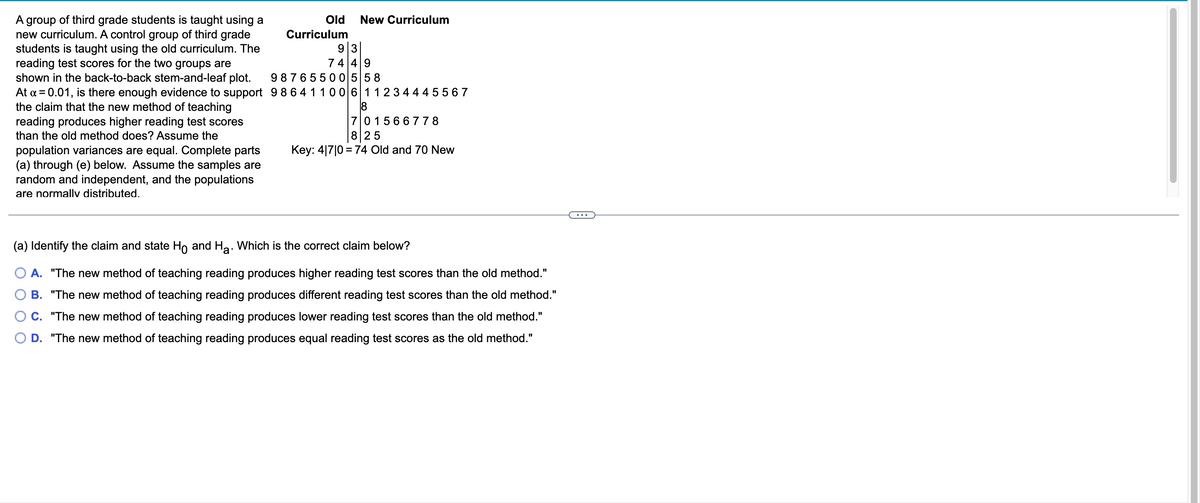
A group of third grade students is taught using a new curriculum. A control group of third grade students is taught using the old curriculum. The reading test scores for the two groups are shown in the back-to-back stem-and-leaf plot. At a = 0.01, is there enough evidence to support the claim that the new method of teaching reading produces higher reading test scores than the old method does? Assume the population variances are equal. Complete parts (a) through (e) below. Assume the samples are random and independent, and the populations are normally distributed. Old New Curriculum Curriculum 9 3 7449 98765500 558 98641100 6 11234445567 8 701566778 825 Key: 41710 = 74 Old and 70 New (a) Identify the claim and state Ho and H₂. Which is the correct claim below? O A. "The new method of teaching reading produces higher reading test scores than the old method." O B. "The new method of teaching reading produces different reading test scores than the old method." OC. "The new method of teaching reading produces lower reading test scores than the old method." OD. "The new method of teaching reading produces equal reading test scores as the old method."
A group of third grade students is taught using a new curriculum. A control group of third grade students is taught using the old curriculum. The reading test scores for the two groups are shown in the back-to-back stem-and-leaf plot. At a = 0.01, is there enough evidence to support the claim that the new method of teaching reading produces higher reading test scores than the old method does? Assume the population variances are equal. Complete parts (a) through (e) below. Assume the samples are random and independent, and the populations are normally distributed. Old New Curriculum Curriculum 9 3 7449 98765500 558 98641100 6 11234445567 8 701566778 825 Key: 41710 = 74 Old and 70 New (a) Identify the claim and state Ho and H₂. Which is the correct claim below? O A. "The new method of teaching reading produces higher reading test scores than the old method." O B. "The new method of teaching reading produces different reading test scores than the old method." OC. "The new method of teaching reading produces lower reading test scores than the old method." OD. "The new method of teaching reading produces equal reading test scores as the old method."

MATLAB: An Introduction with Applications
6th Edition
ISBN:9781119256830
Author:Amos Gilat
Publisher:Amos Gilat
Chapter1: Starting With Matlab
Section: Chapter Questions
Problem 1P

Related questions
Question
.) Find the critical? value(s) and identify the rejection? region(s).
C.) Find the standardized test statistic.
D.) Decide whether to reject or fail to reject the null hypothesis.
E.) Interpret the decision in the context of the original claim.
Transcribed Image Text:A group of third grade students is taught using a
new curriculum. A control group of third grade
students is taught using the old curriculum. The
reading test scores for the two groups are
shown in the back-to-back stem-and-leaf plot.
At α = 0.01, is there enough evidence to support
the claim that the new method of teaching
reading produces higher reading test scores
than the old method does? Assume the
population variances are equal. Complete parts
(a) through (e) below. Assume the samples are
random and independent, and the populations
are normally distributed.
Old New Curriculum
Curriculum
9|3
74 49
98765500558
98641100 6 1 12 34445567
701566778
825
Key: 4|7|0 = 74 Old and 70 New
(a) Identify the claim and state Ho and H₂. Which is the correct claim below?
O A. "The new method of teaching reading produces higher reading test scores than the old method."
B. "The new method of teaching reading produces different reading test scores than the old method."
C. "The new method of teaching reading produces lower reading test scores than the old method."
D. "The new method of teaching reading produces equal reading test scores as the old method."
Expert Solution
This question has been solved!
Explore an expertly crafted, step-by-step solution for a thorough understanding of key concepts.

This is a popular solution!

Trending now
This is a popular solution!

Step by step
Solved in 2 steps

Recommended textbooks for you
MATLAB: An Introduction with Applications
Statistics
ISBN:
9781119256830
Author:
Amos Gilat
Publisher:
John Wiley & Sons Inc

Probability and Statistics for Engineering and th…
Statistics
ISBN:
9781305251809
Author:
Jay L. Devore
Publisher:
Cengage Learning

Statistics for The Behavioral Sciences (MindTap C…
Statistics
ISBN:
9781305504912
Author:
Frederick J Gravetter, Larry B. Wallnau
Publisher:
Cengage Learning
MATLAB: An Introduction with Applications
Statistics
ISBN:
9781119256830
Author:
Amos Gilat
Publisher:
John Wiley & Sons Inc
Probability and Statistics for Engineering and th…
Statistics
ISBN:
9781305251809
Author:
Jay L. Devore
Publisher:
Cengage Learning
Statistics for The Behavioral Sciences (MindTap C…
Statistics
ISBN:
9781305504912
Author:
Frederick J Gravetter, Larry B. Wallnau
Publisher:
Cengage Learning

Elementary Statistics: Picturing the World (7th E…
Statistics
ISBN:
9780134683416
Author:
Ron Larson, Betsy Farber
Publisher:
PEARSON

The Basic Practice of Statistics
Statistics
ISBN:
9781319042578
Author:
David S. Moore, William I. Notz, Michael A. Fligner
Publisher:
W. H. Freeman

Introduction to the Practice of Statistics
Statistics
ISBN:
9781319013387
Author:
David S. Moore, George P. McCabe, Bruce A. Craig
Publisher:
W. H. Freeman