A pet association claims that the mean annual cost of food for dogs and cats are the same. The results for samples for the two types of pets are shown below. At a = 0.01, can you reject the pet association's claim? Assume the population variances are not equal. Assume the samples are random and independent, and the populations are normally distributed. Complete parts (a) through (e) below. Dogs Cats X1 = $231 X2 = $196 S1 = $35 S2 $31 15 n2 9. %3D %3D (a) Identify the claim and state Ho and Ha. Which is the correct claim below? A. "The mean annual cost of food for cats is greater than the cost for dogs." O B. "The mean annual costs of food for dogs and cats are equal." O C. "The mean annual cost of food for dogs is greater than cost for cats." O D. "The mean annual costs of food for dogs and cats are not equal." What are Ho and H,? The null hypothesis, Ho, is The alternative hypothesis, Ha, is Which hypothesis is the claim? The null hypothesis, Ho The alternative hypothesis, Ha (b) Find the critical value(s) and identify the rejection region(s). Enter the critical value(s) below. (Type an integer or decimal rounded to three decimal places as needed. Use a comma to separate answers as needed.) Select the correct rejection region(s) below. O A. - to to O C. t< -to O D. t>to (c) Find the standardized test statistic. (Type an integer or decimal rounded to three decimal places as needed.) (d) Decide whether to reject or fail to reject the null hypothesis. the null hypothesis. (e) Interpret the decision in the context of the original claim.
A pet association claims that the mean annual cost of food for dogs and cats are the same. The results for samples for the two types of pets are shown below. At a = 0.01, can you reject the pet association's claim? Assume the population variances are not equal. Assume the samples are random and independent, and the populations are normally distributed. Complete parts (a) through (e) below. Dogs Cats X1 = $231 X2 = $196 S1 = $35 S2 $31 15 n2 9. %3D %3D (a) Identify the claim and state Ho and Ha. Which is the correct claim below? A. "The mean annual cost of food for cats is greater than the cost for dogs." O B. "The mean annual costs of food for dogs and cats are equal." O C. "The mean annual cost of food for dogs is greater than cost for cats." O D. "The mean annual costs of food for dogs and cats are not equal." What are Ho and H,? The null hypothesis, Ho, is The alternative hypothesis, Ha, is Which hypothesis is the claim? The null hypothesis, Ho The alternative hypothesis, Ha (b) Find the critical value(s) and identify the rejection region(s). Enter the critical value(s) below. (Type an integer or decimal rounded to three decimal places as needed. Use a comma to separate answers as needed.) Select the correct rejection region(s) below. O A. - to to O C. t< -to O D. t>to (c) Find the standardized test statistic. (Type an integer or decimal rounded to three decimal places as needed.) (d) Decide whether to reject or fail to reject the null hypothesis. the null hypothesis. (e) Interpret the decision in the context of the original claim.

Glencoe Algebra 1, Student Edition, 9780079039897, 0079039898, 2018
18th Edition
ISBN:9780079039897
Author:Carter
Publisher:Carter
Chapter10: Statistics
Section10.4: Distributions Of Data
Problem 19PFA

Related questions

Concept explainers
Equations and Inequations
Equations and inequalities describe the relationship between two mathematical expressions.
Linear Functions
A linear function can just be a constant, or it can be the constant multiplied with the variable like x or y. If the variables are of the form, x2, x1/2 or y2 it is not linear. The exponent over the variables should always be 1.
Question
7 solve all parts please
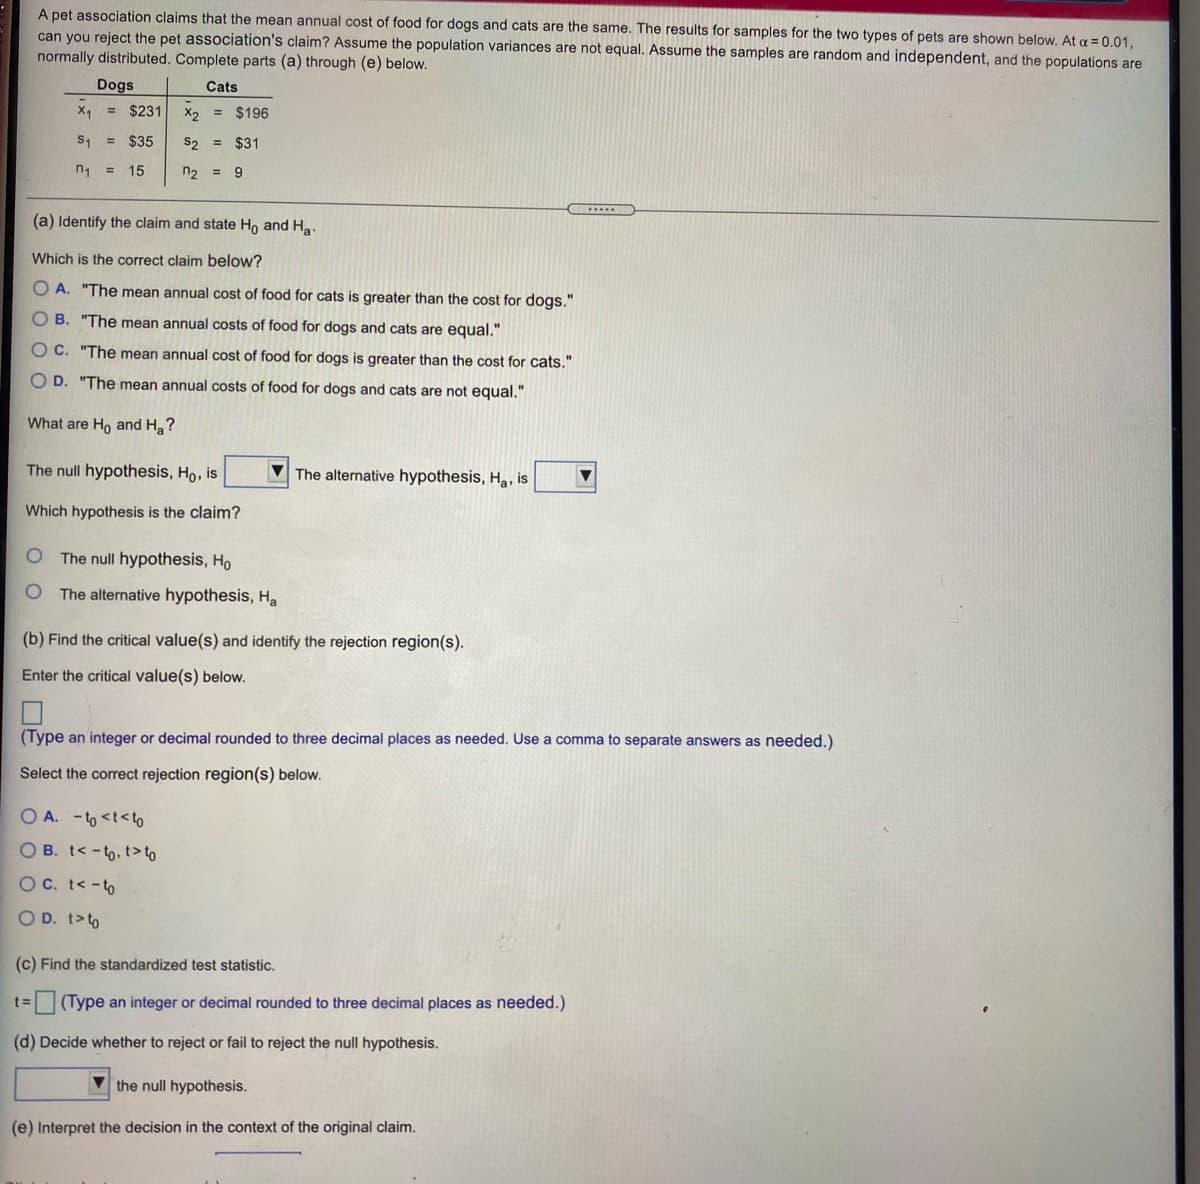
Transcribed Image Text:A pet association claims that the mean annual cost of food for dogs and cats are the same. The results for samples for the two types of pets are shown below. At a = 0.01,
can you reject the pet association's claim? Assume the population variances are not equal. Assume the samples are random and independent, and the populations are
normally distributed. Complete parts (a) through (e) below.
Dogs
Cats
X1
= $231
X2 = $196
S1
= $35
S2 =
$31
n1
15
n2 =
9.
%3D
(a) Identify the claim and state Ho and Ha.
Which is the correct claim below?
A. "The mean annual cost of food for cats is greater than the cost for dogs."
O B. "The mean annual costs of food for dogs and cats are equal."
O C. "The mean annual cost of food for dogs is greater than
cost for cats."
O D. "The mean annual costs of food for dogs and cats are not equal."
What are Ho and H ?
The null hypothesis, Ho, is
The alternative hypothesis, Ha, is
Which hypothesis is the claim?
The null hypothesis, Ho
The alternative hypothesis, Ha
(b) Find the critical value(s) and identify the rejection region(s).
Enter the critical value(s) below.
(Type an integer or decimal rounded to three decimal places as needed. Use a comma to separate answers as needed.)
Select the correct rejection region(s) below.
O A. - to <t<to
O B. t< -to, t> to
OC. t< -to
O D. t>to
(c) Find the standardized test statistic.
(Type an integer or decimal rounded to three decimal places as needed.)
(d) Decide whether to reject or fail to reject the null hypothesis.
V the null hypothesis.
(e) Interpret the decision in the context of the original claim.
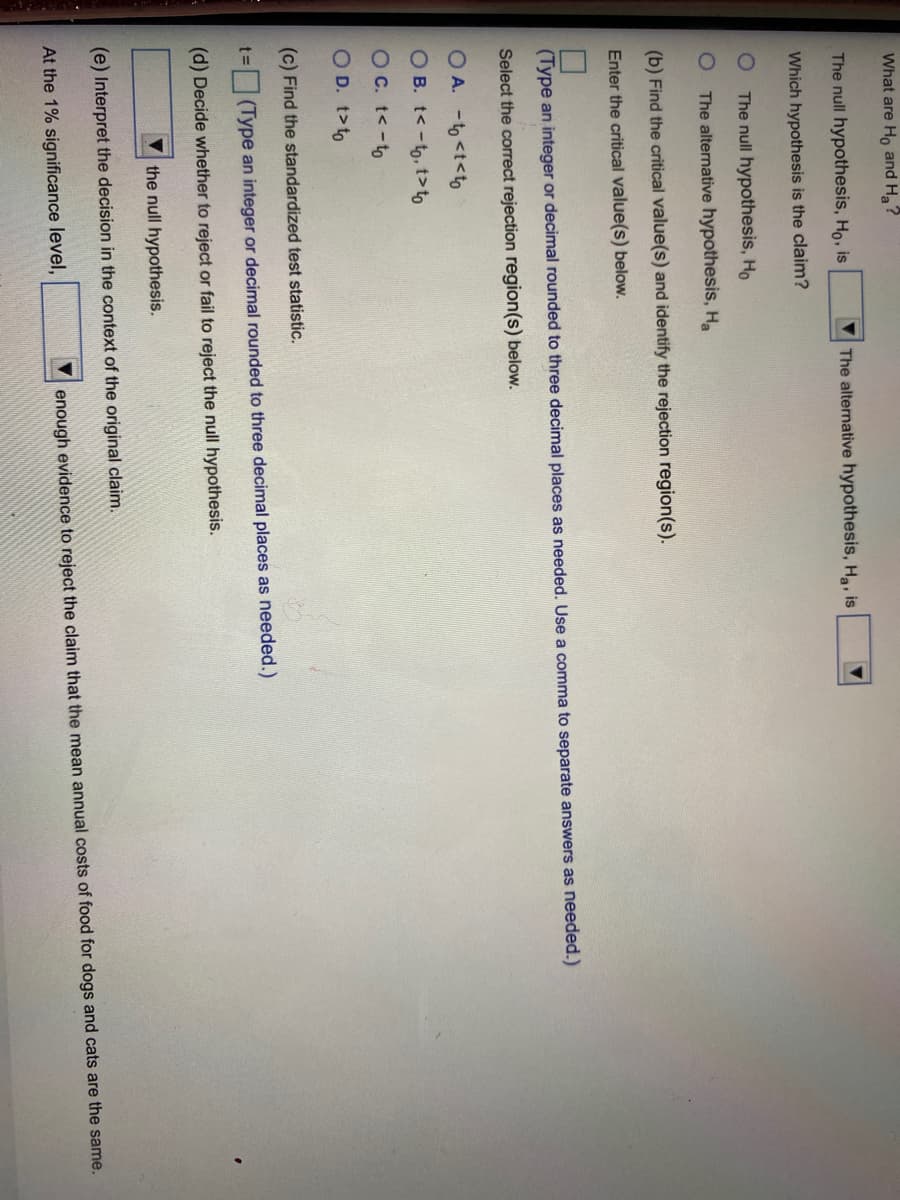
Transcribed Image Text:What are Ho and Ha
The null hypothesis, Ho, is
The alternative hypothesis, Ha, is
Which hypothesis is the claim?
The null hypothesis, Ho
The alternative hypothesis, Ha
(b) Find the critical value(s) and identify the rejection region(s).
Enter the critical value(s) below.
(Type an integer or decimal rounded to three decimal places as needed. Use a comma to separate answers as needed.)
Select the correct rejection region(s) below.
O A. -to <t<to
O B. t< -to, t>to
O C. t< -to
O D. t>to
(c) Find the standardized test statistic.
%3=
(Type an integer or decimal rounded to three decimal places as needed.)
(d) Decide whether to reject or fail to reject the null hypothesis.
the null hypothesis.
(e) Interpret the decision in the context of the original claim.
At the 1% significance level,
enough evidence to reject the claim that the mean annual costs of food for dogs and cats are the same.
Expert Solution
This question has been solved!
Explore an expertly crafted, step-by-step solution for a thorough understanding of key concepts.

This is a popular solution!

Trending now
This is a popular solution!

Step by step
Solved in 3 steps with 4 images

Knowledge Booster


Learn more about
Need a deep-dive on the concept behind this application? Look no further. Learn more about this topic, statistics and related others by exploring similar questions and additional content below.Recommended textbooks for you
Glencoe Algebra 1, Student Edition, 9780079039897…
Algebra
ISBN:
9780079039897
Author:
Carter
Publisher:
McGraw Hill
Glencoe Algebra 1, Student Edition, 9780079039897…
Algebra
ISBN:
9780079039897
Author:
Carter
Publisher:
McGraw Hill