A photoconductor film is manufactured at a nominal thickness of 25 mils. The product engineer wishes to increase the mean speed of the film, and believes that this can be achieved by reducing the thickness of the film to 20 mils. Eight samples of each film thickness are manufactured in a pilot production process, and the film speed (in microjoules per square inch) is measured. For the 25-mil film, the sample data result is I = 1.16 and s = 0.11, while for the 20-mil film, the data yield I, = 1.05 and s2 = 0.09. Note that an increase in film speed would lower the value of the observation in microjoules per square inch. (a) Do the data support the claim that reducing the film thickness increases the mean speed of the film? Use a = 0.10 and assume that the two population variances are equal and the underlying population of film speed is normally distributed. What is the P-value for this test? Round your answer to three decimal places (e.g. 98.765). The data v the claim that reducing the film thickness increases the mean speed of the film. The P-value is i (b) Find a 95% confidence interval on the difference in the two means that can be used to test the claim in part (a). Round your answers to four decimal places (e.g. 98.7654). i < H1 - H2 < i Statistical Tables and Charts
A photoconductor film is manufactured at a nominal thickness of 25 mils. The product engineer wishes to increase the mean speed of the film, and believes that this can be achieved by reducing the thickness of the film to 20 mils. Eight samples of each film thickness are manufactured in a pilot production process, and the film speed (in microjoules per square inch) is measured. For the 25-mil film, the sample data result is I = 1.16 and s = 0.11, while for the 20-mil film, the data yield I, = 1.05 and s2 = 0.09. Note that an increase in film speed would lower the value of the observation in microjoules per square inch. (a) Do the data support the claim that reducing the film thickness increases the mean speed of the film? Use a = 0.10 and assume that the two population variances are equal and the underlying population of film speed is normally distributed. What is the P-value for this test? Round your answer to three decimal places (e.g. 98.765). The data v the claim that reducing the film thickness increases the mean speed of the film. The P-value is i (b) Find a 95% confidence interval on the difference in the two means that can be used to test the claim in part (a). Round your answers to four decimal places (e.g. 98.7654). i < H1 - H2 < i Statistical Tables and Charts

Algebra & Trigonometry with Analytic Geometry
13th Edition
ISBN:9781133382119
Author:Swokowski
Publisher:Swokowski
Chapter7: Analytic Trigonometry
Section7.6: The Inverse Trigonometric Functions
Problem 91E

Related questions
Question
26.
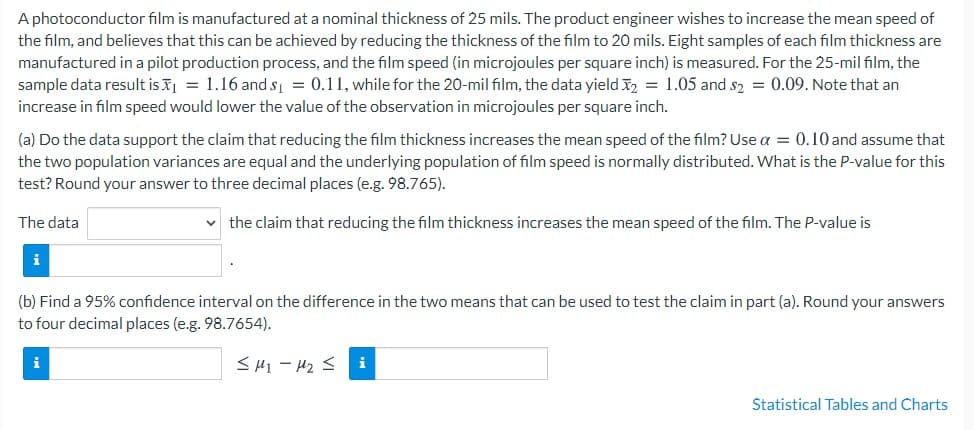
Transcribed Image Text:A photoconductor film is manufactured at a nominal thickness of 25 mils. The product engineer wishes to increase the mean speed of
the film, and believes that this can be achieved by reducing the thickness of the film to 20 mils. Eight samples of each film thickness are
manufactured in a pilot production process, and the film speed (in microjoules per square inch) is measured. For the 25-mil film, the
sample data result is = 1.16 and s = 0.11, while for the 20-mil film, the data yield 2 = 1.05 and s2 = 0.09. Note that an
increase in film speed would lower the value of the observation in microjoules per square inch.
(a) Do the data support the claim that reducing the film thickness increases the mean speed of the film? Use a = 0.10 and assume that
the two population variances are equal and the underlying population of film speed is normally distributed. What is the P-value for this
test? Round your answer to three decimal places (e.g. 98.765).
The data
the claim that reducing the film thickness increases the mean speed of the film. The P-value is
i
(b) Find a 95% confidence interval on the difference in the two means that can be used to test the claim in part (a). Round your answers
to four decimal places (e.g. 98.7654).
i
< H1 - H2 S
i
Statistical Tables and Charts
Expert Solution
This question has been solved!
Explore an expertly crafted, step-by-step solution for a thorough understanding of key concepts.

This is a popular solution!

Trending now
This is a popular solution!

Step by step
Solved in 3 steps with 3 images

Recommended textbooks for you
Algebra & Trigonometry with Analytic Geometry
Algebra
ISBN:
9781133382119
Author:
Swokowski
Publisher:
Cengage

Glencoe Algebra 1, Student Edition, 9780079039897…
Algebra
ISBN:
9780079039897
Author:
Carter
Publisher:
McGraw Hill

Algebra & Trigonometry with Analytic Geometry
Algebra
ISBN:
9781133382119
Author:
Swokowski
Publisher:
Cengage
Glencoe Algebra 1, Student Edition, 9780079039897…
Algebra
ISBN:
9780079039897
Author:
Carter
Publisher:
McGraw Hill