Q3. Which diagram shows the Reject Region on the z axis for a Two-tail tail at the 1% Significance Level using a z test statistic: 0.025 0.005 0.005 4.96 1.96 267 257 D. None of these. Q,05 O A. A О В. В О С. С O D. D
Q3. Which diagram shows the Reject Region on the z axis for a Two-tail tail at the 1% Significance Level using a z test statistic: 0.025 0.005 0.005 4.96 1.96 267 257 D. None of these. Q,05 O A. A О В. В О С. С O D. D

Holt Mcdougal Larson Pre-algebra: Student Edition 2012
1st Edition
ISBN:9780547587776
Author:HOLT MCDOUGAL
Publisher:HOLT MCDOUGAL
Chapter11: Data Analysis And Probability
Section: Chapter Questions
Problem 8CR

Related questions
Question
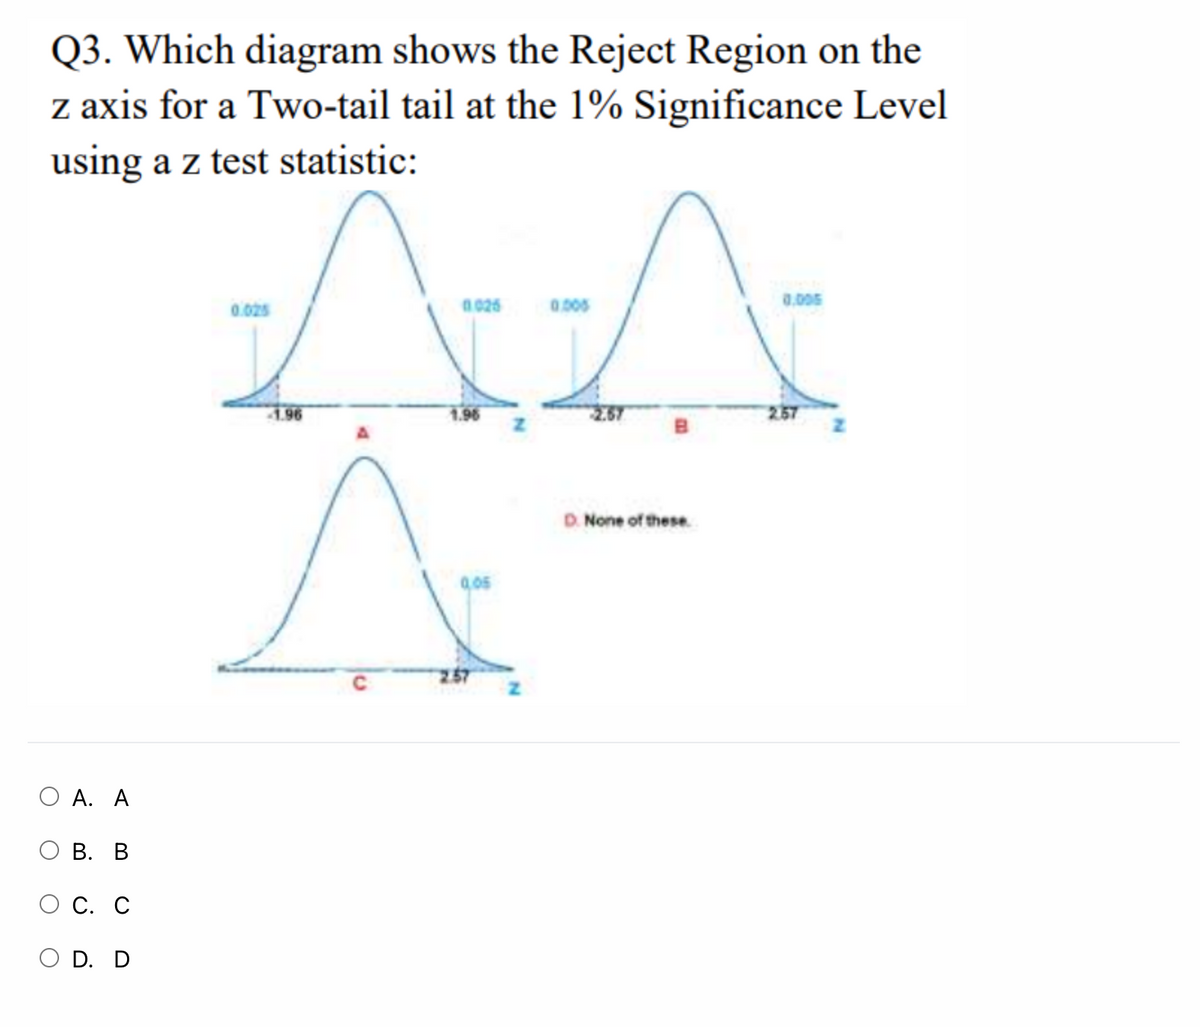
Transcribed Image Text:Q3. Which diagram shows the Reject Region on the
z axis for a Two-tail tail at the 1% Significance Level
using a z test statistic:
0.005
0.025
a 026
0.005
1.96
1.96
257
D. None of these.
O A. A
В. В
О С. С
O D. D
Expert Solution
This question has been solved!
Explore an expertly crafted, step-by-step solution for a thorough understanding of key concepts.

Step by step
Solved in 2 steps with 1 images

Recommended textbooks for you
Holt Mcdougal Larson Pre-algebra: Student Edition…
Algebra
ISBN:
9780547587776
Author:
HOLT MCDOUGAL
Publisher:
HOLT MCDOUGAL
Holt Mcdougal Larson Pre-algebra: Student Edition…
Algebra
ISBN:
9780547587776
Author:
HOLT MCDOUGAL
Publisher:
HOLT MCDOUGAL