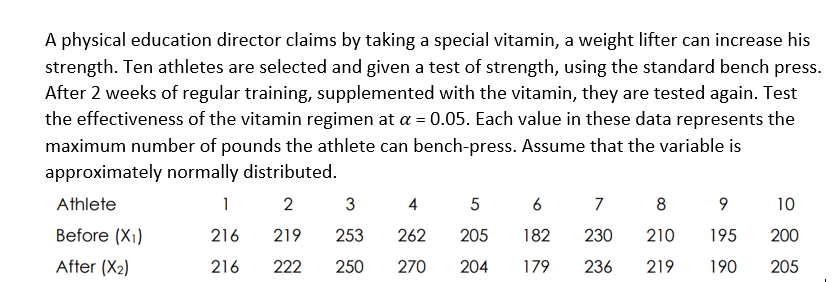
A physical education director claims by taking a special vitamin, a weight lifter can increase his strength. Ten athletes are selected and given a test of strength, using the standard bench press. After 2 weeks of regular training, supplemented with the vitamin, they are tested again. Test the effectiveness of the vitamin regimen at a = 0.05. Each value in these data represents the maximum number of pounds the athlete can bench-press. Assume that the variable is approximately normally distributed.
Q: (a) Find the least-squares regression line treating the number of absences, x, as the explanatory…
A: Given: x y 0 88.5 1 85.6 2 82.7 3 80.2 4 77.2 5 72.8 6 63.1 7 67.7 8 64.9 9…
Q: The following table shows the length, In centimeters, of the humerus and the total wingspan, In…
A: The regression equation isy^=20.32x+21.05 b)If x=52, theny=20.3252+21.05=1077.69
Q: Use the Third Paired Data Set. Find the equation for the least-squares regression line.
A: 34. Excel Procedure: Enter x and y in Excel>Data>Data Analysis> ‘Regression’>Select y…
Q: The file P10 14V2.xlsx I includes data on the 50 top graduate programs in the United States,…
A: Given: SALARY OVERALL SCORE GMAT GPA 145987 100 720 3.2 135971 99 726 3.3 121544 93 710…
Q: Find the least square regression equation for the data in the table below. x 14 37 43 25 25 25 15…
A: Solution: The given data is
Q: Find the variance with solution
A:
Q: Suppose that the line ŷ = 5 + 2x is fitted to the data points (-2,2), (1,6), and (5,14). Determine…
A: The residual is defined as r = y - yestimated Firstly, it is required to calculate the residuals for…
Q: In a simple linear regression, show that the OLS regression line always passes through the mean…
A: Let, yi=a+bxi+ui be the population regression line and yi=a^+b^xi+ei^ be the sample regression…
Q: A study has been proposed to investigate the relationship between the birthweight of male babies and…
A: We can write the information in the table given below: Birthweight is denoted by X Adult height is…
Q: Using the LSRL, y hat = -25.5+1.5x, what is the residual for the data point at (28,19)
A: Linear regression: Suppose (x1, y1), (x2, y2)---(xn, yn) are n pairs of observations on variables X…
Q: Prior to being hired, the ve salespersons for a computer store were given a standard sales aptitude…
A: Let Y be the Units sold in 3 months (dependent variable) and X be the score on aptitude test…
Q: Carrie and Ryan have both computed the slope of the least-squares line using data for which the…
A:
Q: A company trains its employees with instructional videos and claims that the amount of time, in…
A: It is given that sample size (n) is 5, the slope (b1) is 0.8 and SE of hours is 0.3464.
Q: A random sample of 42 earthquakes that have occurred between January 2015 and September 2017 was…
A: Explanation: Independent variable: A variable whose deviation doesn't depend on another variable is…
Q: The researcher found that the model’s effect size was very large where R = .957. Furthermore, R2 =…
A:
Q: Consider a special linear regression model in which each observation has its own slope coeficient:…
A: Given the special linear regression model as yi=xiβi+εi , i=1, . . . , n
Q: In multiple regression, when all independent variables are considered at the same same, it is…
A: In multiple regression, when all independent variables are considered at the same same, is called…
Q: Suppose that a kitchen cabinet warehouse company would like to be able to predict the area of a…
A:
Q: In the context of the linear regression model, briefly explain why it makes sense to provide a…
A: Introduction: Suppose ŷ is the predicted value of the response variable, y in a linear regression…
Q: The following table shows the length, in centimeters of the humerus and the total wingspan, in…
A: The data shows the length in centimeters of the HUMERUS and the total WINGSPAN in centimeters of…
Q: Find out the regression coeticients of Y on X and X on Y from the following data: ΣΧ= 50 , X= 5, Σ Υ…
A:
Q: = r· Zx
A: Introduction: Consider that x is the independent variable and y is the dependent variable. The size…
Q: Because elderly people may nave dificulty standing to have their height measured, a study looked at…
A: Calculate Fitting a straight line - Curve fitting using Least square method X Y 56.8 189.6…
Q: A researcher is going to conduct a regression line and created the following scatter plot that…
A: In multiple linear regression, there will be more than one independent variable. In simple linear…
Q: The random sample of 5 school students is selected and their marks in statistics and accountancy are…
A: The regression line are used to predict the future values. There are two types of regression lines,…
Q: To determine the effectiveness of group study sessions, a college instructor gathers data on hours…
A: In regression theory, dependent variable is the response variable, which is predicted using the…
Q: A teacher measured the hours of study of seven students in one week and compared the results with…
A: a. Regression: The regression analysis is conducted using EXCEL. The software procedure is given…
Q: (a) Calculate A, B, C, D and E. (b) At a = 0.05 test whether the regression model are fit.
A: The Analysis of variance for the simple linear regression table is given.
Q: In a simple linear regression analysis, the correlation coefficient (r) and the slope (b)…
A: Here, r is the linear correlation coefficient and b is the slope of a regression. If the sign r is…
Q: What is the differed annual expenditures of two families if their annual net incomes are differed by…
A: Let y1 and y2 be the annual expenditures of the familiesand Let x1 and x2 be their net incomes.We…
Q: In a statistical study, it is found that variables x and y are correlated as follows. Find the least…
A: Step-by-step procedure to find the regression line using Excel: In Excel sheet, enter x and y in…
Q: A candy bar manufacturer is interested in trying to estimate how sales are influenced by the price…
A:
Q: Which of the following residual plots suggests that a linear model may not be applicable to the data…
A: The residuals (e) are calculated by taking difference between observed value and predicted value…
Q: Which of the following is not an example of a Continuous Data?
A: Given: 3 laptops 1.32 miles 7.25 inches 3.25 kg
Q: For a sample of 41 California cities, a sociologist studies the crime rate in each city (crimes per…
A: Given : SSE = 4182663 SST = 7732451 Using the formula or regression sum : SST = SSR + SSE SSR = SST…
Q: Use the table of x and y values below to determine the slope of the least-squares regression line.
A: Given Data : X Y 0 125 10 120 20 100 30 115 40 115 50 90 60 85 70 65 For…
Q: In baseball, two statistics, the ERA (Earned Run Average) and the WHIP (Walks and Hits per Inning…
A: Interpret the slope. The correct option is identified below: From the information given that The…
Q: Given a generic data set (x,y) with a linear regression. How do you determine if the y(dependent)…
A: Linear regression is a linear method used to model the relationship between response and one or more…
Q: In a simple regression, the ordinary least squares estimate of the slope coefficient is expected to…
A: The simple linear regression model is defined by the equation: There are parameters β0, β1, and σ2,…
Q: Determine if the data are approximately normally distributed. Please use R software.
A: Given the data, we have to Determine if the data are approximately normally distributed using R…
Q: A regression line describes the relationship between the dependent and independent variables and can…
A: Solution: As the regression shows the relationship between the independent and dependent variables.…
Q: Draw the scatter plot and compute the predicted equation of the line using the least square…
A: Note: Hi there! Thank you for posting the question. As you have posted multiple questions, as per…
Q: cher in Alaska measured the age (in months) and the weight (in pounds) of a random sample of…
A: Correlation is defined as the linear relationship between the two variables. The range of the…
Q: The sum of squares measures the variability of the observed values around their respective treatment…
A: In analysis of variance, total sum of squares is divided into sum of squares between and sum of…
Q: The table below shows the data of x and ý for teh respor a) Draw the scatter diagram and draw the…
A: This question is based on regression analysis. Given data :
Q: The table below shows the number of hours per day 11 patients suffered from headaches before and…
A: There are 2 dependent samples which are daily headache hours before and after. We have to test…
Q: Suppose John is a high school statistics teacher who believes that watching many hours of TV leads…
A:
Q: )A study was conducted to detemine whether a the final grade of a student in an introductory…
A: Use EXCEL to obtain the regression equation. EXCEL procedure: Go to EXCEL Go to Data>Data…
Equations and Inequations
Equations and inequalities describe the relationship between two mathematical expressions.
Linear Functions
A linear function can just be a constant, or it can be the constant multiplied with the variable like x or y. If the variables are of the form, x2, x1/2 or y2 it is not linear. The exponent over the variables should always be 1.
Trending now
This is a popular solution!
Step by step
Solved in 2 steps with 3 images
- Find the equation of the regression line for the following data set. x 1 2 3 y 0 3 4According to a newspaper study of more than 1 million medical dispatches from 2007 to 2012, the 911 response time for medical aid varies dramatically across a city. Under national standards adopted by the city's fire department, rescuers are supposed to arrive within six minutes to almost all medical emergencies. But the newspaper analysis found that in affluent hillside communities of the city, firefighters failed to hit that mark nearly 85% of the time. The following data show the response times, in minutes, for 10 emergency calls in the Griffith Park neighborhood. 11.8 10.3 10.7 10.6 11.5 8.3 10.5 10.9 10.7 11.2 Based on this sample of ten response times, compute the descriptive statistics (in minutes) in parts (a) and (b) and then answer the questions in parts (c) and (d). (a) mean, median, and mode (in min) mean minmedian minmode min (b) range and standard deviation (in min) (Round your answers to four decimal places.) range minstandard deviation min (c) Compute…The Us food and Drug administration has a limit for mercury content in fish of 1.0ppm (parts per million) while in Canada the limit is 0.5 ppm. Using the variable average mercury in the Florida lakes dataset to test whether there is evidence that average mercury level of fish ( large mouth Bass) in Florida lakes is less than 1.0ppm and whether there is evidence that average mercury level of fish in Florida lakes is less than 0.5ppm. STATE THE NULL AND ALTERNATIVE HYPOTHESES? GIVE THE TEST STATISTICS AND P-VALUE? round the test statistic to two decimal places and the p-value to three decimal places. DOES THIS SAMPLE PROVIDE EVIDENCE THAT THE AVERAGE MERCURY LEVEL OF FISH (LARGE MOUTH BASS) IN FLORIDA LAKES IS LESS THAN 1.0PPM? LESS THAN 0.5 PPM : STATE THE NULL AND ALTERNATIVE HYPOTHESES. GIVE THE TEST STATISTICS AND P-VALUE ? round the test statistic to two decimal places and the p-value to three decimal places. DOES THIS SAMPLE PROVIDE EVIDENCE THAT THE AVERAGE MERCURY…
- A study was undertaken to determine whether there was a significant weight (in lb) loss after one year course of therapy for diabetes, and whether the amount of weight (in lb) loss was related to initial weight. The following table gives the initial weight (x) and weight after one year of therapy (y) for 16 newly diagnosed adult diabetic patients.In a recent survey, ice cream truck drivers in Cincinnati, Ohio, reported they make about $280 in income on a typical summer day. The income was generally higher on days with longer work hours, particularly hot day, and on holidays. The IceCream data file includes five weeks of the driver's daily income (Income), number of hours on the road (Hours), whether it was a particularly hot day (Hot = 1 if the high temperature was above 85-degrees F, 0 otherwise), and whether it was a Holiday (Holiday = 1, 0 otherwise). 1. Predict the income of a driver working 8 hours on a hot holiday. (Round to the nearest dollar.) 2. Predict the income of a driver working 8 hours on a hot day if it was not a holiday. (Round to the nearest dollar.)The owner of a moving company typically has his most experienced manager predict the total number of labor hours that will be required to complete an upcoming move. This approach has proved useful in the past, but the owner has the business objective of developing a more accurate method of predicting labor hours. In a preliminary effort to provide a more accurate method, the owner has decided to use the number of cubic feet moved as the independent variable and has collected data for 36 moves in which the origin and destination were within the borough of Manhattan in New York City and in which the travel time was an insignificant portion of the hours worked. If the sum of squares Y is 1,513.32 and the sum of squares error is 176.22. What proportion of variation in labor hours is explained by the number of cubic feet moved? Hint: Provide answer accurate to 4 decimal places.
- The owner of a moving company typically has his most experienced manager predict the total number of labor hours that will be required to complete an upcoming move. This approach has proved useful in the past, but the owner has the business objective of developing a more accurate method of predicting labor hours. In a preliminary effort to provide a more accurate method, the owner has decided to use the number of cubic feet moved as the independent variable and has collected data for 36 moves in which the origin and destination were within the borough of Manhattan in New York City and in which the travel time was an insignificant portionof the hours worked. The intercept for the sample regression line that the owner has computed is -2.24 and the slope is 0.03. What is the predicted number of labor hours for moving 484 cubic feet? Hint: Provide your answer accurate to 2 decimal places.To determine if chocolate milk was as effective as other carbohydrate replacement drinks, nine male cyclists performed an intense workout followed by a drink and a rest period. At the end of the rest period, each cyclist performed an endurance trial where he exercised until exhausted and time to exhaustion was measured. Each cyclist completed the entire regimen on two different days. On one day the drink provided was chocolate milk and on the other day the drink provided was a carbohydrate replacement drink. Data consistent with summary quantities appear in the table below. (Use a statistical computer package to calculate the P-value. Subtract the carbohydrate replacement times from the chocolate milk times. Round your test statistic to two decimal places, your df down to the nearest whole number, and the P-value to three decimal places.) I need the answer for: t= df= P=To determine if chocolate milk was as effective as other carbohydrate replacement drinks, nine male cyclists performed an intense workout followed by a drink and a rest period. At the end of the rest period, each cyclist performed an endurance trial where he exercised until exhausted and time to exhaustion was measured. Each cyclist completed the entire regimen on two different days. On one day the drink provided was chocolate milk and on the other day the drink provided was a carbohydrate replacement drink.Data consistent with summary quantities appear in the table below. (Use a statistical computer package to calculate the P-value. Subtract the carbohydrate replacement times from the chocolate milk times. Round your test statistic to two decimal places, your df down to the nearest whole number, and the P-value to three decimal places.) Cyclist Time to Exhaustion (minutes) 1 2 3 4 5 6 7 8 9 ChocolateMilk 34.26 44.62 40.47 36.82 40.57 54.80 25.99 51.14 37.33…
- To determine if chocolate milk was as effective as other carbohydrate replacement drinks, nine male cyclists performed an intense workout followed by a drink and a rest period. At the end of the rest period, each cyclist performed an endurance trial where he exercised until exhausted and time to exhaustion was measured. Each cyclist completed the entire regimen on two different days. On one day the drink provided was chocolate milk and on the other day the drink provided was a carbohydrate replacement drink. Data consistent with summary quantities appear in the table below. (Use a statistical computer package to calculate the P-value. Subtract the carbohydrate replacement times from the chocolate milk times. Round your test statistic to two decimal places, your df down to the nearest whole number, and your P-value to three decimal places.) Cyclist Time to Exhaustion (minutes) 1 2 3 4 5 6 7 8 9 ChocolateMilk 27.69 51.46 35.32 23.84 36.39 22.28 54.43 55.26 29.59…To determine if chocolate milk was as effective as other carbohydrate replacement drinks, nine male cyclists performed an intense workout followed by a drink and a rest period. At the end of the rest period, each cyclist performed an endurance trial where he exercised until exhausted and time to exhaustion was measured. Each cyclist completed the entire regimen on two different days. On one day the drink provided was chocolate milk and on the other day the drink provided was a carbohydrate replacement drink.Data consistent with summary quantities appear in the table below. (Use a statistical computer package to calculate the P-value. Subtract the carbohydrate replacement times from the chocolate milk times. Round your test statistic to two decimal places, your df down to the nearest whole number, and the P-value to three decimal places.) Cyclist Time to Exhaustion (minutes) 1 2 3 4 5 6 7 8 9 ChocolateMilk 48.65 55.02 53.71 38.49 40.59 54.20 28.85 26.64 58.97…To determine if chocolate milk was as effective as other carbohydrate replacement drinks, nine male cyclists performed an intense workout followed by a drink and a rest period. At the end of the rest period, each cyclist performed an endurance trial where he exercised until exhausted and time to exhaustion was measured. Each cyclist completed the entire regimen on two different days. On one day the drink provided was chocolate milk and on the other day the drink provided was a carbohydrate replacement drink. Data consistent with summary quantities appear in the table below. (Use a statistical computer package to calculate the P-value. Subtract the carbohydrate replacement times from the chocolate milk times. Round your test statistic to two decimal places, your df down to the nearest whole number, and the P-value to three decimal places.) t= 1.93 df= 8 p=? Is there sufficient evidence to suggest that the mean time to exhaustion is greater after chocolate milk than after…