A plant operation has fixed costs of $1,000,000 per year, and its output capacity is 100,000 electrical appliances per year. The variable cost is $50 per unit, and the product sells for $75 per unit. a. Construct the economic breakeven chart. b. Compare annual profit when the plant is operating at 70% of capacity with the plant operation at 100% capacity. Assume that the first 70% of capacity output is sold at $75 per unit and that the remaining 30% of production is sold at $65 per unit. properly label your lines. Use the point drawing tool to plot the Breakeven point. Be sure to properly label the point. Cost and Revenue, $ 10,000,000- 9,000,000 8,000,000 7,000,000 6,000,000 5,000,000 4,000,000 3,000,000 2,000,000 1,000,000 0 20,000 ... 40,000 60,000 PALA 80,000 100,000 E
A plant operation has fixed costs of $1,000,000 per year, and its output capacity is 100,000 electrical appliances per year. The variable cost is $50 per unit, and the product sells for $75 per unit. a. Construct the economic breakeven chart. b. Compare annual profit when the plant is operating at 70% of capacity with the plant operation at 100% capacity. Assume that the first 70% of capacity output is sold at $75 per unit and that the remaining 30% of production is sold at $65 per unit. properly label your lines. Use the point drawing tool to plot the Breakeven point. Be sure to properly label the point. Cost and Revenue, $ 10,000,000- 9,000,000 8,000,000 7,000,000 6,000,000 5,000,000 4,000,000 3,000,000 2,000,000 1,000,000 0 20,000 ... 40,000 60,000 PALA 80,000 100,000 E

Chapter1: Making Economics Decisions
Section: Chapter Questions
Problem 1QTC

Related questions
Question
Answer All parts show steps
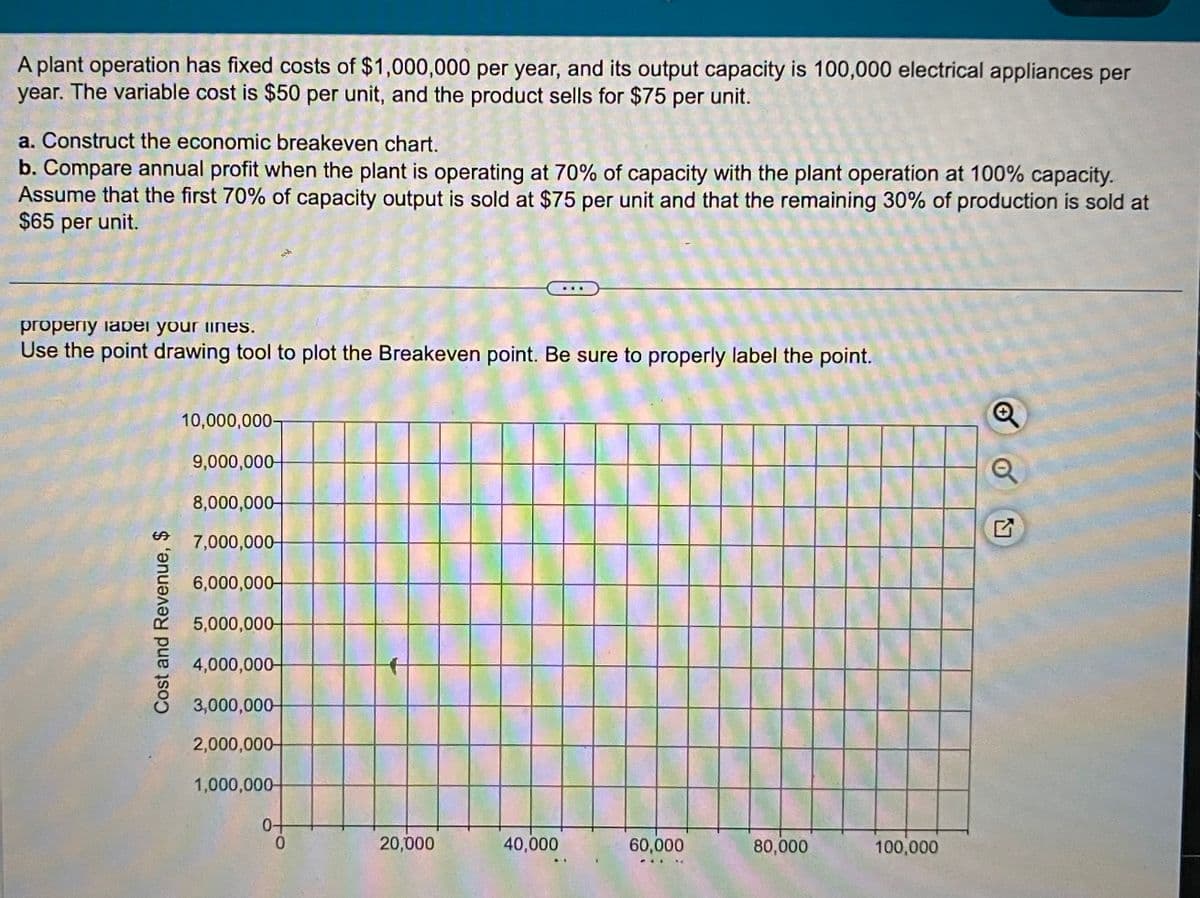
Transcribed Image Text:A plant operation has fixed costs of $1,000,000 per year, and its output capacity is 100,000 electrical appliances per
year. The variable cost is $50 per unit, and the product sells for $75 per unit.
a. Construct the economic breakeven chart.
b. Compare annual profit when the plant is operating at 70% of capacity with the plant operation at 100% capacity.
Assume that the first 70% of capacity output is sold at $75 per unit and that the remaining 30% of production is sold at
$65 per unit.
properly label your lines.
Use the point drawing tool to plot the Breakeven point. Be sure to properly label the point.
Cost and Revenue, $
10,000,000-
9,000,000-
8,000,000
7,000,000-
6,000,000-
5,000,000
4,000,000
3,000,000
2,000,000
1,000,000-
0+
0
20,000
40,000
60,000
80,000
100,000
Q
Q
Expert Solution
This question has been solved!
Explore an expertly crafted, step-by-step solution for a thorough understanding of key concepts.

This is a popular solution!

Trending now
This is a popular solution!

Step by step
Solved in 4 steps with 6 images

Knowledge Booster


Learn more about
Need a deep-dive on the concept behind this application? Look no further. Learn more about this topic, economics and related others by exploring similar questions and additional content below.Recommended textbooks for you

Principles of Economics (12th Edition)
Economics
ISBN:
9780134078779
Author:
Karl E. Case, Ray C. Fair, Sharon E. Oster
Publisher:
PEARSON

Engineering Economy (17th Edition)
Economics
ISBN:
9780134870069
Author:
William G. Sullivan, Elin M. Wicks, C. Patrick Koelling
Publisher:
PEARSON
Principles of Economics (12th Edition)
Economics
ISBN:
9780134078779
Author:
Karl E. Case, Ray C. Fair, Sharon E. Oster
Publisher:
PEARSON
Engineering Economy (17th Edition)
Economics
ISBN:
9780134870069
Author:
William G. Sullivan, Elin M. Wicks, C. Patrick Koelling
Publisher:
PEARSON

Principles of Economics (MindTap Course List)
Economics
ISBN:
9781305585126
Author:
N. Gregory Mankiw
Publisher:
Cengage Learning

Managerial Economics: A Problem Solving Approach
Economics
ISBN:
9781337106665
Author:
Luke M. Froeb, Brian T. McCann, Michael R. Ward, Mike Shor
Publisher:
Cengage Learning

Managerial Economics & Business Strategy (Mcgraw-…
Economics
ISBN:
9781259290619
Author:
Michael Baye, Jeff Prince
Publisher:
McGraw-Hill Education