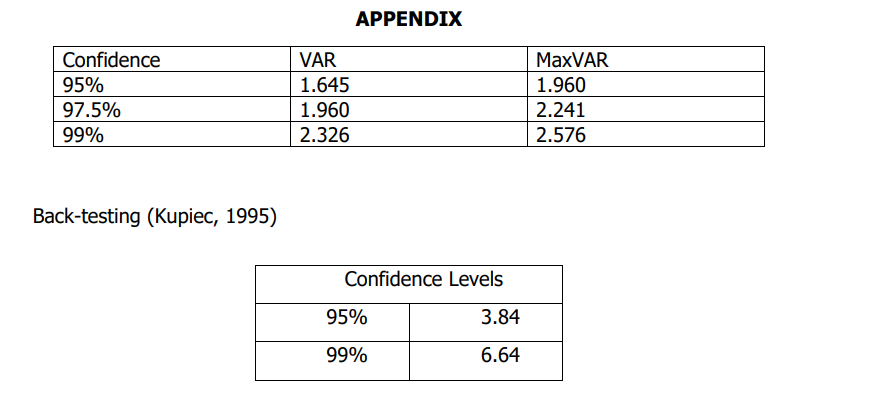
A portfolio manager has positions that include a £100,000 investment in A Corp and a £75,000 investment is B Corp. The position in A Corp has standard deviation of gains and losses of 35% per annum whilst the position in B Corp has standard deviation of gains and losses of 22% per annum. Gains and losses for both A Corp and B Corp are normally distributed while the returns A Corp and B Corp have correlation -0.6 (minus 0.6). When necessary, assume 252 trading days in the calendar year. Based on the above and the table in the Appendix: a) Calculate the 1-day 99% VaR of A Corp and of B Corp b) Calculate the 1-day 99% Expected Shortfall (ES) of A Corp and of B Corp c) Using your answers to (a) and (b) calculate the 1-month VaR and ES of A Corp and of B Corp.
A portfolio manager has positions that include a £100,000 investment in A Corp and a
£75,000 investment is B Corp. The position in A Corp has standard deviation of gains
and losses of 35% per annum whilst the position in B Corp has standard deviation of
gains and losses of 22% per annum. Gains and losses for both A Corp and B Corp are
0.6). When necessary, assume 252 trading days in the calendar year. Based on the
above and the table in the Appendix:
a) Calculate the 1-day 99% VaR of A Corp and of B Corp
b) Calculate the 1-day 99% Expected Shortfall (ES) of A Corp and of B Corp
c) Using your answers to (a) and (b) calculate the 1-month VaR and ES of A Corp and
of B Corp.
d) Calculate the 1-month 99% VaR and ES of the portfolio
e) Calculate the 1-month 99% marginal VaR of each position. Interpret your answer
f) Can the portfolio manager increase the position of A Corp to reduce their market risk
exposure? Justify your answer
g) What is the component VaR of each position?
h) What would be the advantages and disadvantages of using Expected Shortfall rather
than Value at Risk to measure the risk of this portfolio

Step by step
Solved in 4 steps


