-A professor from a Quantitative Methods in Business course decided to research the relationship between the Mid Term Exam, the average number of study hours spent per week during the semester and the final course grade for a given student. A sample of containing data from a previous semester was provided by the instructor and summarized in the following table: # of Students Mid-Term exam Study hours per Final course grade week grade 50.0 2.0 65.0 60.0 4.0 85.0 55.0 3.5 75.0 4 85.0 6.0 90.0 55.0 5.0 70.0 72.0 4.5 89.0 75.0 6.5 91.0 8 45.0 3.0 65.0 88.0 5.5 89.0 10 90.0 7.5 96.0 Develop a linear regression model, where Y is the Final Grade Course and X is the Mid-Term Exam. Calculate the coefficient of determination (r 2 ), the coefficient of correlation (r), the variance (o 2) for On 1. 2. 3. 5.
-A professor from a Quantitative Methods in Business course decided to research the relationship between the Mid Term Exam, the average number of study hours spent per week during the semester and the final course grade for a given student. A sample of containing data from a previous semester was provided by the instructor and summarized in the following table: # of Students Mid-Term exam Study hours per Final course grade week grade 50.0 2.0 65.0 60.0 4.0 85.0 55.0 3.5 75.0 4 85.0 6.0 90.0 55.0 5.0 70.0 72.0 4.5 89.0 75.0 6.5 91.0 8 45.0 3.0 65.0 88.0 5.5 89.0 10 90.0 7.5 96.0 Develop a linear regression model, where Y is the Final Grade Course and X is the Mid-Term Exam. Calculate the coefficient of determination (r 2 ), the coefficient of correlation (r), the variance (o 2) for On 1. 2. 3. 5.

Glencoe Algebra 1, Student Edition, 9780079039897, 0079039898, 2018
18th Edition
ISBN:9780079039897
Author:Carter
Publisher:Carter
Chapter4: Equations Of Linear Functions
Section4.5: Correlation And Causation
Problem 11PPS

Related questions
Question
Transcribed Image Text:ont
Paragraph
Styles
Editing
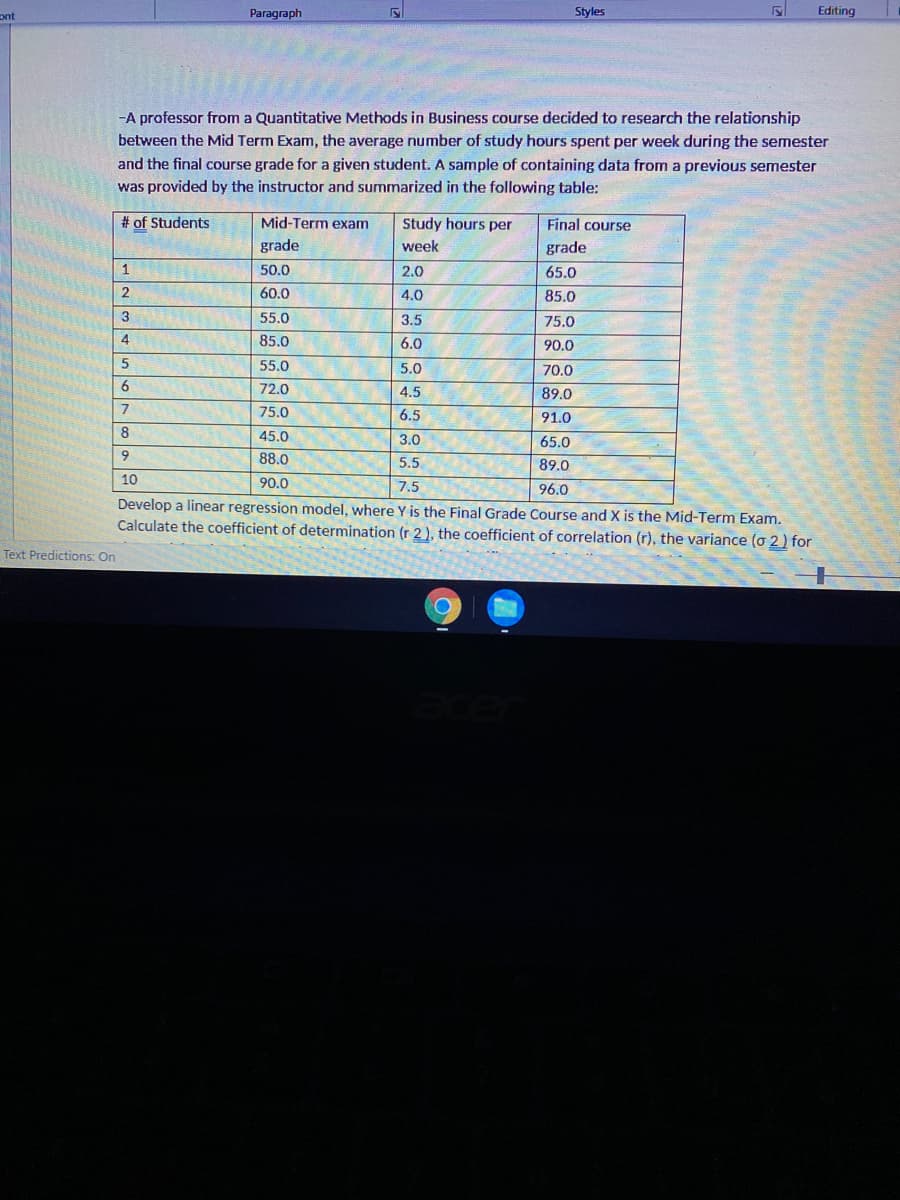
-A professor from a Quantitative Methods in Business course decided to research the relationship
between the Mid Term Exam, the average number of study hours spent per week during the semester
and the final course grade for a given student. A sample of containing data from a previous semester
was provided by the instructor and summarized in the following table:
# of Students
Mid-Term exam
Study hours per
Final course
grade
week
grade
1
50.0
2.0
65.0
60.0
4.0
85.0
55.0
3.5
75.0
4
85.0
6.0
90.0
55.0
5.0
70.0
6.
72.0
4.5
89.0
7
75.0
6.5
91.0
8
45.0
3.0
65.0
6.
88.0
5.5
89.0
10
90.0
7.5
96.0
Develop a linear regression model, where Y is the Final Grade Course and X is the Mid-Term Exam.
Calculate the coefficient of determination (r 2 , the coefficient of correlation (r), the variance (o 2) for
Text Predictions: On
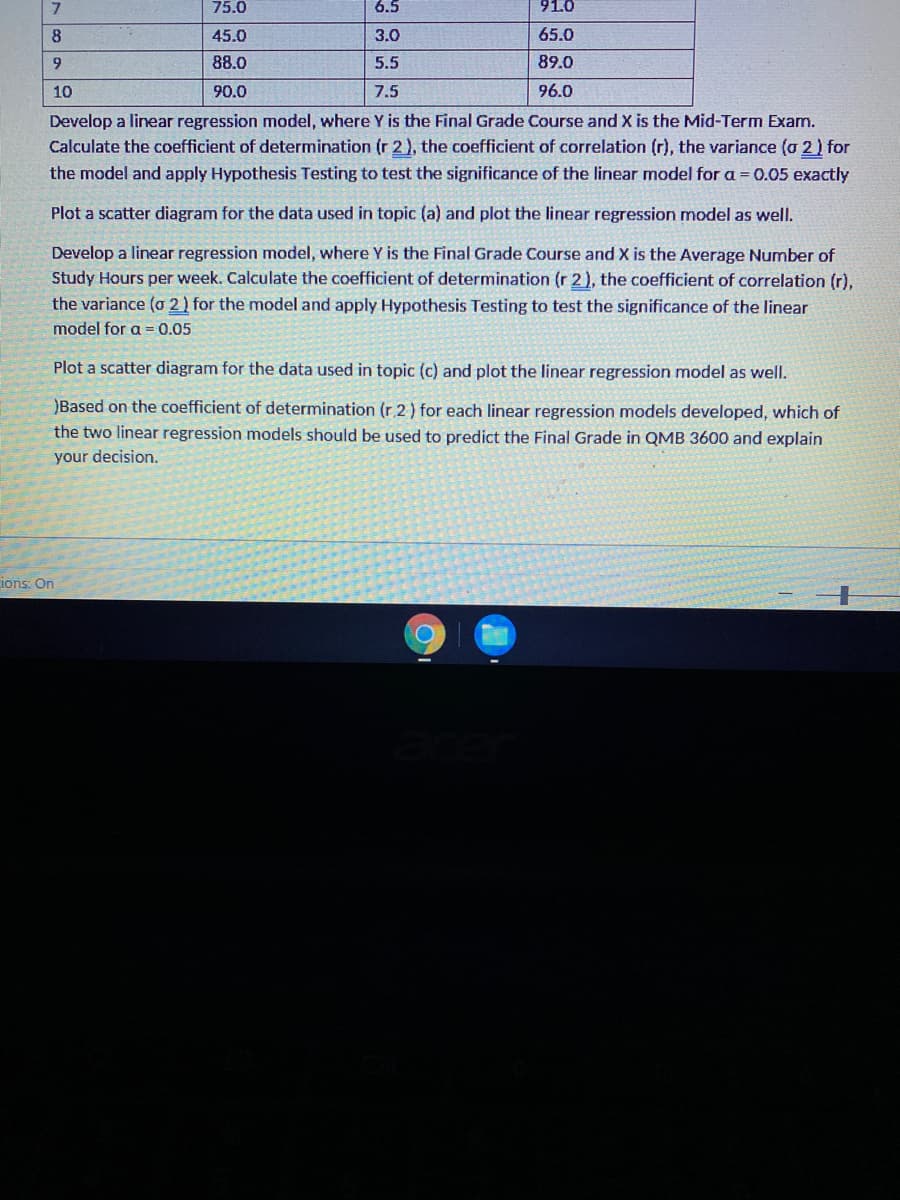
Transcribed Image Text:75.0
6.5
91.0
8
45.0
3.0
65.0
9.
88.0
5.5
89.0
10
90.0
7.5
96.0
Develop a linear regression model, where Y is the Final Grade Course and X is the Mid-Term Exam.
Calculate the coefficient of determination (r 2), the coefficient of correlation (r), the variance (a 2 ) for
the model and apply Hypothesis Testing to test the significance of the linear model for a = 0.05 exactly
Plot a scatter diagram for the data used in topic (a) and plot the linear regression model as well.
Develop a linear regression model, where Y is the Final Grade Course and X is the Average Number of
Study Hours per week. Calculate the coefficient of determination (r 2), the coefficient of correlation (r),
the variance (o 2) for the model and apply Hypothesis Testing to test the significance of the linear
model for a = 0.05
Plot a scatter diagram for the data used in topic (c) and plot the linear regression model as well.
Based on the coefficient of determination (r.2) for each linear regression models developed, which of
the two linear regression models should be used to predict the Final Grade in QMB 3600 and explain
your decision.
ions: On
Expert Solution
This question has been solved!
Explore an expertly crafted, step-by-step solution for a thorough understanding of key concepts.

This is a popular solution!

Trending now
This is a popular solution!

Step by step
Solved in 4 steps

Recommended textbooks for you
Glencoe Algebra 1, Student Edition, 9780079039897…
Algebra
ISBN:
9780079039897
Author:
Carter
Publisher:
McGraw Hill

Big Ideas Math A Bridge To Success Algebra 1: Stu…
Algebra
ISBN:
9781680331141
Author:
HOUGHTON MIFFLIN HARCOURT
Publisher:
Houghton Mifflin Harcourt

Holt Mcdougal Larson Pre-algebra: Student Edition…
Algebra
ISBN:
9780547587776
Author:
HOLT MCDOUGAL
Publisher:
HOLT MCDOUGAL
Glencoe Algebra 1, Student Edition, 9780079039897…
Algebra
ISBN:
9780079039897
Author:
Carter
Publisher:
McGraw Hill
Big Ideas Math A Bridge To Success Algebra 1: Stu…
Algebra
ISBN:
9781680331141
Author:
HOUGHTON MIFFLIN HARCOURT
Publisher:
Houghton Mifflin Harcourt
Holt Mcdougal Larson Pre-algebra: Student Edition…
Algebra
ISBN:
9780547587776
Author:
HOLT MCDOUGAL
Publisher:
HOLT MCDOUGAL