Use the graph below to determine a possible range for the correlation coefficient between the two variables. 40 35 30 25 20 15 10 10 20 30 40 50 60 70 -0.7 1 O 0.7
Use the graph below to determine a possible range for the correlation coefficient between the two variables. 40 35 30 25 20 15 10 10 20 30 40 50 60 70 -0.7 1 O 0.7

Glencoe Algebra 1, Student Edition, 9780079039897, 0079039898, 2018
18th Edition
ISBN:9780079039897
Author:Carter
Publisher:Carter
Chapter4: Equations Of Linear Functions
Section4.6: Regression And Median-fit Lines
Problem 4PPS

Related questions
Question
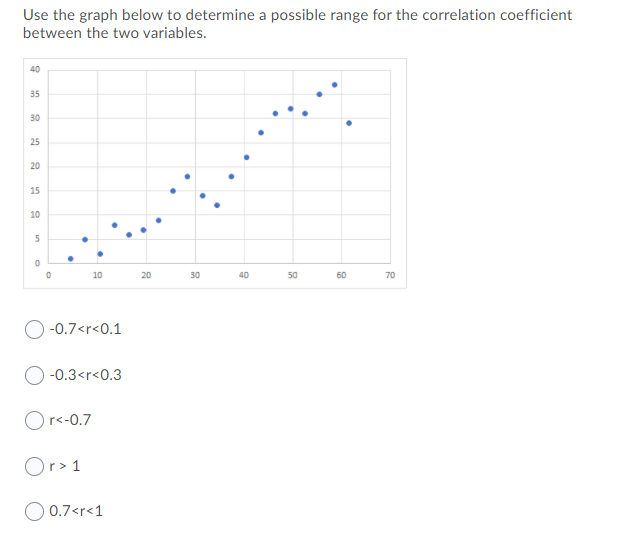
Transcribed Image Text:Use the graph below to determine a possible range for the correlation coefficient
between the two variables.
40
35
30
25
20
15
10
5
10
20
30
40
50
60
70
-0.7<r<0.1
-0.3<r<0.3
Or<-0.7
Or> 1
O 0.7<r<1
in
Expert Solution
This question has been solved!
Explore an expertly crafted, step-by-step solution for a thorough understanding of key concepts.

Step by step
Solved in 2 steps with 2 images

Recommended textbooks for you
Glencoe Algebra 1, Student Edition, 9780079039897…
Algebra
ISBN:
9780079039897
Author:
Carter
Publisher:
McGraw Hill

Big Ideas Math A Bridge To Success Algebra 1: Stu…
Algebra
ISBN:
9781680331141
Author:
HOUGHTON MIFFLIN HARCOURT
Publisher:
Houghton Mifflin Harcourt

Holt Mcdougal Larson Pre-algebra: Student Edition…
Algebra
ISBN:
9780547587776
Author:
HOLT MCDOUGAL
Publisher:
HOLT MCDOUGAL
Glencoe Algebra 1, Student Edition, 9780079039897…
Algebra
ISBN:
9780079039897
Author:
Carter
Publisher:
McGraw Hill
Big Ideas Math A Bridge To Success Algebra 1: Stu…
Algebra
ISBN:
9781680331141
Author:
HOUGHTON MIFFLIN HARCOURT
Publisher:
Houghton Mifflin Harcourt
Holt Mcdougal Larson Pre-algebra: Student Edition…
Algebra
ISBN:
9780547587776
Author:
HOLT MCDOUGAL
Publisher:
HOLT MCDOUGAL