A professor is concerned that the two sections of college algebra that he teaches are not performing at the same level. To test his claim, he looks at the mean exam score for a random sample of students from each of his classes. In Class 1, the mean exam score for 15 students is 81.2 with a standard deviation of 3.4. In Class 2, the mean exam score for 18 students is 83.8 with a standard deviation of 5.9. Test the professor's claim at the 0.10 level of significance. Assume that both populations are approximately normal and that the population variances are equal. Let Class 1 be Population 1 and let Class 2 be Population 2. Step 3 of 3: Draw a conclusion and interpret the decision. 曲 Tables E Keypad Answer Keyboard Shortcuts We reject the null hypothesis and conclude that there is insufficient evidence at a 0.10 level of significance to say that the mean exam scores for the two classes are different. We fail to reject the null hypothesis and conclude that there is insufficient evidence at a 0.10 level of significance to say that the mean exam scores for the two classes are different. We fail to reject the null hypothesis and conclude that there is sufficient evidence at a 0.10 level of significance to say that the mean exam scores for the two classes are different. We reject the null hypothesis and conclude that there is sufficient evidence at a 0.10 level of significance to say that the mean exam scores for the two classes are different.
A professor is concerned that the two sections of college algebra that he teaches are not performing at the same level. To test his claim, he looks at the mean exam score for a random sample of students from each of his classes. In Class 1, the mean exam score for 15 students is 81.2 with a standard deviation of 3.4. In Class 2, the mean exam score for 18 students is 83.8 with a standard deviation of 5.9. Test the professor's claim at the 0.10 level of significance. Assume that both populations are approximately normal and that the population variances are equal. Let Class 1 be Population 1 and let Class 2 be Population 2. Step 3 of 3: Draw a conclusion and interpret the decision. 曲 Tables E Keypad Answer Keyboard Shortcuts We reject the null hypothesis and conclude that there is insufficient evidence at a 0.10 level of significance to say that the mean exam scores for the two classes are different. We fail to reject the null hypothesis and conclude that there is insufficient evidence at a 0.10 level of significance to say that the mean exam scores for the two classes are different. We fail to reject the null hypothesis and conclude that there is sufficient evidence at a 0.10 level of significance to say that the mean exam scores for the two classes are different. We reject the null hypothesis and conclude that there is sufficient evidence at a 0.10 level of significance to say that the mean exam scores for the two classes are different.

Glencoe Algebra 1, Student Edition, 9780079039897, 0079039898, 2018
18th Edition
ISBN:9780079039897
Author:Carter
Publisher:Carter
Chapter10: Statistics
Section10.4: Distributions Of Data
Problem 19PFA

Related questions
Question
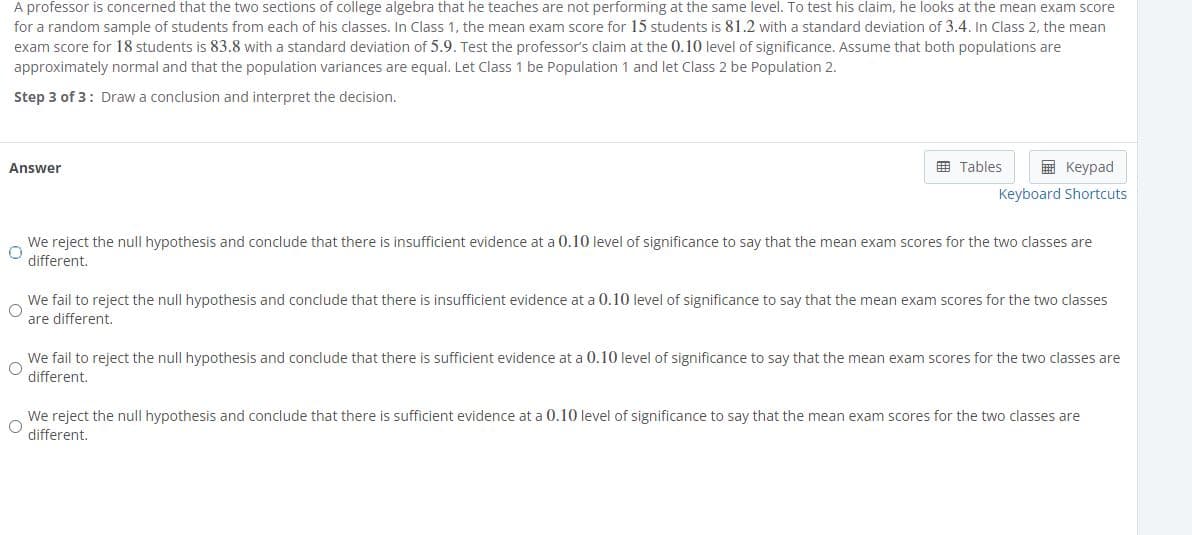
Transcribed Image Text:A professor is concerned that the two sections of college algebra that he teaches are not performing at the same level. To test his claim, he looks at the mean exam score
for a random sample of students from each of his classes. In Class 1, the mean exam score for 15 students is 81.2 with a standard deviation of 3.4. In Class 2, the mean
exam score for 18 students is 83.8 with a standard deviation of 5.9. Test the professor's claim at the 0.10 level of significance. Assume that both populations are
approximately normal and that the population variances are equal. Let Class 1 be Population 1 and let Class 2 be Population 2.
Step 3 of 3: Draw a conclusion and interpret the decision.
田 Tables
E Keypad
Answer
Keyboard Shortcuts
We reject the null hypothesis and conclude that there is insufficient evidence at a 0.10 level of significance to say that the mean exam scores for the two classes are
different.
We fail to reject the null hypothesis and conclude that there is insufficient evidence at a 0.10 level of significance to say that the mean exam scores for the two classes
are different.
We fail to reject the null hypothesis and conclude that there is sufficient evidence at a 0.10 level of significance to say that the mean exam scores for the two classes are
different.
We reject the null hypothesis and conclude that there is sufficient evidence at a 0.10 level of significance to say that the mean exam scores for the two classes are
different.
Expert Solution
This question has been solved!
Explore an expertly crafted, step-by-step solution for a thorough understanding of key concepts.

This is a popular solution!

Trending now
This is a popular solution!

Step by step
Solved in 2 steps with 1 images

Recommended textbooks for you
Glencoe Algebra 1, Student Edition, 9780079039897…
Algebra
ISBN:
9780079039897
Author:
Carter
Publisher:
McGraw Hill
Glencoe Algebra 1, Student Edition, 9780079039897…
Algebra
ISBN:
9780079039897
Author:
Carter
Publisher:
McGraw Hill