A project has four activities (A, B, C, and D) that must be performed sequentially. The probability distributions for the time required to complete each of the activities are as follows. Activity Activity Time (weeks) Probability 5 0.20 6. 0.35 0.30 8 0.15 B 3 0.15 5 0.60 7. 0.25 10 0.10 12 0.25 14 0.35 16 0.25 18 0.05 8 0.65 10 0.35 (a) Construct a spreadsheet simulation model to estimate the average length of the project (in weeks) and the standard deviation of the project length. (Use at least 1,000 trials. Rour
A project has four activities (A, B, C, and D) that must be performed sequentially. The probability distributions for the time required to complete each of the activities are as follows. Activity Activity Time (weeks) Probability 5 0.20 6. 0.35 0.30 8 0.15 B 3 0.15 5 0.60 7. 0.25 10 0.10 12 0.25 14 0.35 16 0.25 18 0.05 8 0.65 10 0.35 (a) Construct a spreadsheet simulation model to estimate the average length of the project (in weeks) and the standard deviation of the project length. (Use at least 1,000 trials. Rour

College Algebra
7th Edition
ISBN:9781305115545
Author:James Stewart, Lothar Redlin, Saleem Watson
Publisher:James Stewart, Lothar Redlin, Saleem Watson
Chapter9: Counting And Probability
Section9.3: Binomial Probability
Problem 33E: Sick leave probability that a given worker at Dyno Nutrition Will call in sick on a Monday is 004....

Related questions
Question
Find part a and b
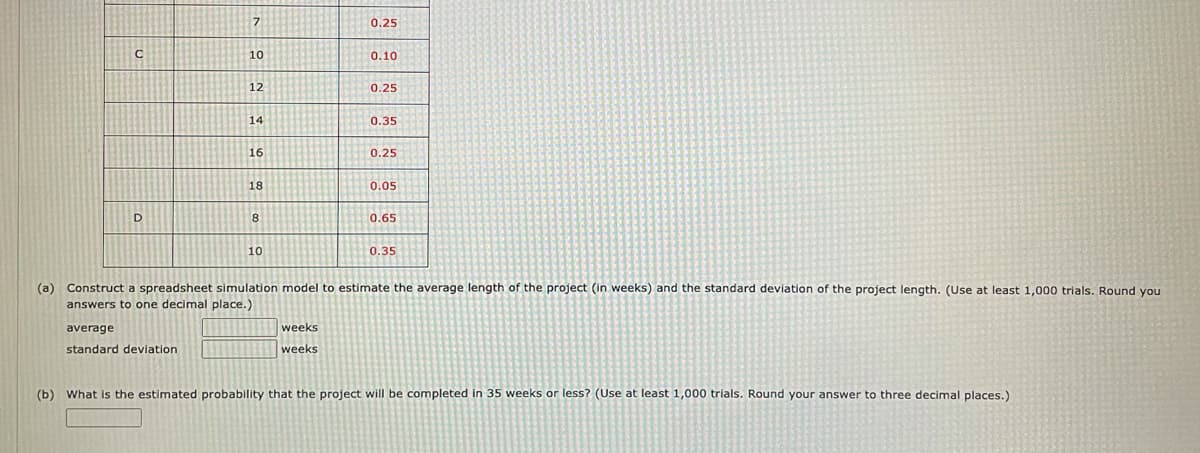
Transcribed Image Text:0.25
10
0.10
12
0.25
14
0.35
16
0.25
18
0.05
0.65
10
0.35
(a)
Construct a spreadsheet simulation model to estimate the average length of the project (in weeks) and the standard deviation of the project length. (Use at least 1,000 trials. Round you
answers to one decimal place.)
average
weeks
standard deviation
weeks
(b) What is the estimated probability that the project will be completed in 35 weeks or less? (Use at least 1,000 trials. Round your answer to three decimal places.)
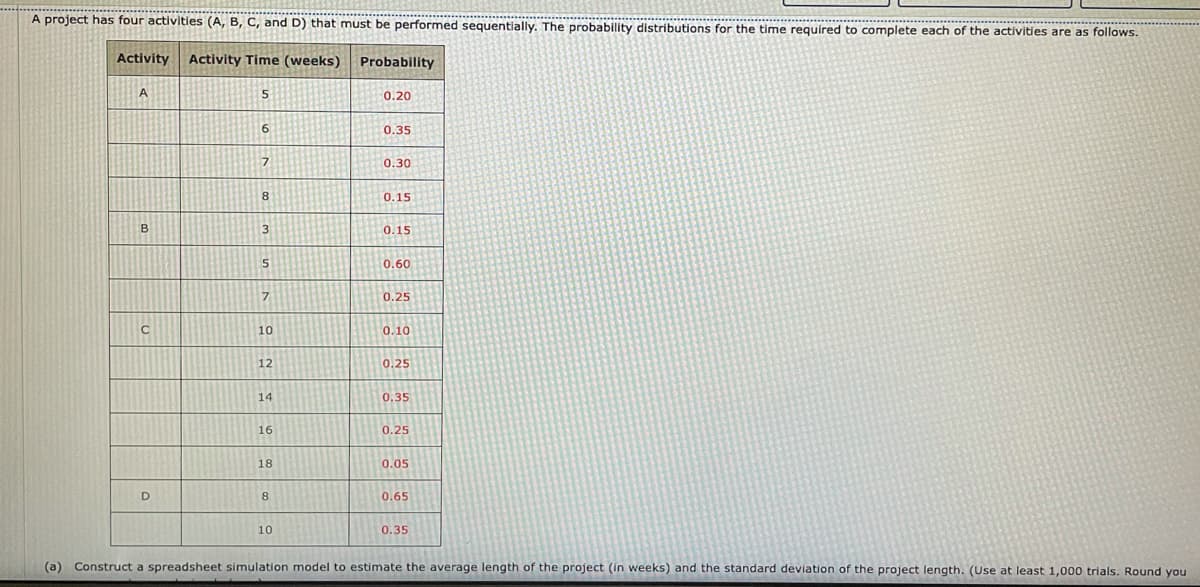
Transcribed Image Text:A project has four activities (A, B, C, and D) that must be performed sequentially. The probability distributions for the time required to complete each of the activities are as follows.
Activity
Activity Time (weeks)
Probability
5.
0.20
6
0.35
0.30
8
0.15
в
3
0.15
0.60
0.25
10
0.10
12
0.25
14
0.35
16
0.25
18
0.05
D
8
0.65
10
0.35
(a) Construct a spreadsheet simulation model to estimate the average length of the project (in weeks) and the standard deviation of the project length. (Use at least 1,000 trials. Round you
Expert Solution
This question has been solved!
Explore an expertly crafted, step-by-step solution for a thorough understanding of key concepts.

This is a popular solution!

Trending now
This is a popular solution!

Step by step
Solved in 3 steps with 3 images

Recommended textbooks for you
College Algebra
Algebra
ISBN:
9781305115545
Author:
James Stewart, Lothar Redlin, Saleem Watson
Publisher:
Cengage Learning

College Algebra
Algebra
ISBN:
9781305115545
Author:
James Stewart, Lothar Redlin, Saleem Watson
Publisher:
Cengage Learning