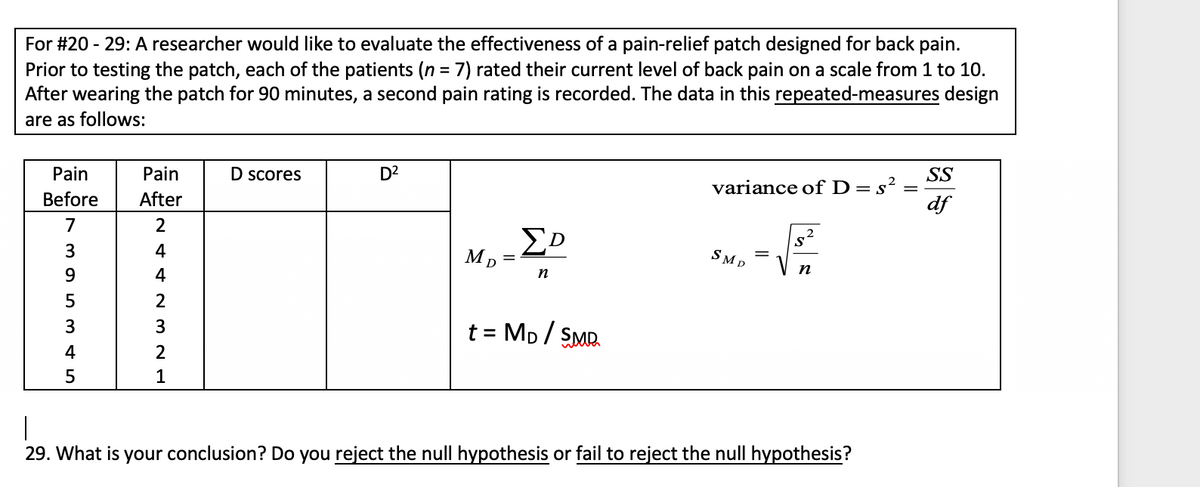
29. What is your conclusion? Do you reject the null hypothesis or fail to reject the null hypothesis?


Q: how far from the mean in terms of the standard deviation are the following height of the students?
A: here given, The average height of the students in Ms. Joan’s class is 130 cm. Assuming that the…
Q: 70, 11). Suppose that you form random samples of 25 from this distribution. Let X be the random…
A: Given n=25, population mean μ=70, standard deviations σ=11 Note: This probability value calculated…
Q: There are 225 participating dogs at the National Dog Show that weigh an average of 5 kilos, with a…
A:
Q: For a certain year, a study reports that the percentage of college students using credit cards was…
A:
Q: A Repeated-Measures study using a sample of n = 20 participants would produce a t-statistic with df…
A: We have given following statement A Repeated measures study using of n = 20 participants would…
Q: 4. What change in the number of days is associated with an increase of 1.5 of the index? 5. What…
A: Given :
Q: Compute difference scores for each participant. Insert them into the table!
A: The difference for each participant is defined as D = Before - After
Q: Frank surveyed 220 students to see which sports they like, here is the information that Frank got:…
A: Given that ; n = 220 By using basic probability venn diagram solve this problem. Note ; According…
Q: n = 480 and X = 384, construct a 90% confidence interval for the population proportion, p. Give…
A: Here is given that, n =480 x = 384 We will use one proportion z confidence interval.
Q: Suppose you work for an organization that runs tests for life-threatening diseases and then…
A: Consider scenario 1: Suppose you work for an organization that runs tests for life-threatening…
Q: The R-squared of a regression of an asset’s excess returns against a multi-factor asset pricing…
A: Given information: The information about coefficient of determination is given.
Q: Answer the problem and show your solution: You are planning to buy a cellphone with a good quality…
A: Given that n=50 , Mean=x̄=13500 , Margin of error=E=273.65 99% confidence level Note: According to…
Q: Illustrate and find the area under the stand normal curve 1. Between z= -1.45 and z=1 2. To the left…
A: Let Z be the random variable from standard normal distribution with mean = 0 and standard deviation…
Q: For #1 - 9: The Psychology Department faculty are wondering whether a free tutoring program will…
A: The random variable X follows normal distribution. We have to find the value of the test statistic.…
Q: h solving the AN
A: By using ONE WAY ANOVA k = no of treatments = 3+1 = 4 N = total sum = 3+3+3 +3 = 12 df(between) =…
Q: A psychologist is interested in constructing a 95% confidence interval for the proportion of people…
A: For the given data Find a. With 95% confidence the proportion of all people who accept the theory…
Q: Fireworks on July 4th: In late June 2012, Survey USA published results of a survey stating that 54%…
A: We have given that, Sample size (n) = 581, confidence level = 95% and sample proportion (p̂) = 54%…
Q: An article in Air and Waste ["Update on Ozone Trends in California's South Coast Air Basin" (Vol.…
A: Given: Days Index 91 16.7 105 17.1 106 18.2 108 18.1 88 17.2 91 18.2 58 16 82…
Q: The average time for a one way trip for a student to go to school is 24 minutes with a standard…
A:
Q: Taking log on both sides we get, In (L(a = 2, B)) =-2n·In (B)+ In Ex, Now partially differentiating…
A: Given that
Q: 24. The National Education Association (NEA) states that the national mean salary of public school…
A:
Q: D. Find the values of the t-distribution that bound the middle a. 0.80 of the area under the curve…
A: “Since you have asked multiple questions, we will solve the first question for you. If you want any…
Q: V (a) Show that the joint pdf for U, V is of the form f(z, y) = {2 exp(-u-v), if (u, v) E A %3D…
A: We will use Jacobian method of transformation to find the joint pdf of U and V.
Q: Ages Vs Systolic Perform the following regression: X = [21, 31, 33, 40, 20, 27, 18, 39, 36, 44,…
A: Use the Excel and Perform the Regression. Followings are the Steps to perform the Regression 1) Open…
Q: Consider the mull hypothesis Hsp0.65. Suppose arandom sample of 1000 observations is taken to…
A: Given Sample size=1000 Null hypothesis is H0=0.65
Q: ou are conducting a hypothesis test where alternative (research) hypothesis is that mu is greater…
A:
Q: Illustration 16.68. A number x is chosen at random from the inte- n and A andB denotes the events…
A:
Q: Use the currency exchange rates in the table for the following question. Currency British pound…
A:
Q: Assume that a randomly selected subject is given a bone density test. Those test scores are normally…
A: Given Those test scores are normally distributed with a mean of 0 and a standard deviation of 1.
Q: Given the following data for an imaginary superhero universe: Flying Telepathy Super Strength Female…
A: From the provided information, Flying Telepathy Super Strength Total Female 96…
Q: b. Assume the following results: 2600 subjects were enrolled in the study. Of these subjects 220 who…
A: Given Information: There are a total of 2600 subjects in the study. 220 subjects had diabetes and a…
Q: 01S6 00 3. Section C 9 10 11 13 14 15 Prevous Next Attempted: 0/20 Question 11 O Revisit Later…
A: Given that Median for individuals series in ascending order where the number of observation is even
Q: Y 1 2 14 The analyst now wishes to determine whether this is a good or bad model. To do this, she…
A: Since you have posted a question with multiple subparts, we will solve first three subparts for you.…
Q: Edit View History Bookmarks Window Help oSave OFF SMH M 台90^G心 Design Layout References Mailings >>…
A: We have given that the information of survey of the COVID-19 pandemic affected academic performance…
Q: The average American consumes 100 liters of alcohol per year. Does the average college student…
A:
Q: Use the zz-score formula, z=x−μσz=x−μσ, and the information below to find the mean, μμ. Round your…
A: Using the z-score formula and the given information, we have to find the mean.
Q: . The weights of ice cream cartons are normally distributed with a mean weight of 13 ounces and a…
A:
Q: PROBLEM 3 Patients arriving at an outpatient clinic are routinely screened for high blood pressure.…
A: Let there is a sequence of trials, each having two outcomes, say Success and Failure, trials being…
Q: Health Care Public Option: A poll was conducted in 2009 in order to evaluate support for the healht…
A: From the provided information,
Q: A sample of 13 small bags of the same brand of candies was selected. Assume that the population…
A: Given, n= 13 mean= 3 std. dev. =0.15 Population std. dev. = 0.1 Confidence interval for mean: Error…
Q: A particular lake is known to be one of the best places to catch a certain type of fish. In this…
A: A particular lake is known to be one of the best places to catch a certain type of fish. In this…
Q: The Jones family was one of the first to come to the U.S. They had 6 children. Assuming that the…
A: As per Bartleby guideline expert have to answer first question only dear student please upload other…
Q: the clain that the The null and alternative hypothesis would be: O Ho:p = 0.85 H1:p > 0.85 O Ho:p =…
A: According to guidelines we solve first three subparts when given multiple subparts
Q: The owner of a small pet supply store wants to open a second store in another city, but he only…
A:
Q: Given a normally distributed data, what is the area of the region less than one standard deviation…
A: Given that Empirical rule: Approximately 68% of a data from a normal distribution lies within 1…
Q: 35. Which statement below accurately describes the relationship between the alpha level, the size of…
A: We have given the following statement the relationship between the alpha level, the size of the…
Q: he weight of all cans of coffee has a standard deviation of 0.34 ounces. A sample of 79 cans of…
A:
Q: a sample of n=16 individuals is selected from a population with u = 30. After a treatment is…
A:
Q: Print Expert, Inc. purchases plastic cups on which to print logos for sporting events, proms,…
A: It is given that n=300 and x=15.
Q: The researchers of a study wish to compare the proportion of participants in two samples that…
A: From the provided information, Confidence level = 95% Margin of error = 0.3
29

Step by step
Solved in 2 steps with 3 images

- For the following exercises, refer to Table 12. Use a graphing calculator to create a scatter diagram of the data.For the following exercises, consider this scenario: The population of a city increased steadily overa ten-year span. The following ordered pairs show the population and the year over the ten-year span (population, year) for specific recorded years: (3,600,2000);(4,000,2001);(4,700,2003);(6,000,2006) 44. What is the correlation coefficient for this model tothree decimal places of accuracy?X Y 1 6 4 1 1 4 1 3 3 1 Which of the following scatterplots accurately depicts this set of scores?
- A study conducted by students in an AP Psychologyclass at South Kent School in Connecticut discovereda correlation of –0.38 between hours of sleep (x) andGPA (y). If we change the variable on the horizontal axisto hours awake (24 - x), but make no change to theGPA data, which of the following would be true aboutthe new scatterplot?A) It slopes down, and the correlation is -0.38.B) It slopes down, and the correlation is +0.38.C) It slopes up, and the correlation is -0.38.D) It slopes up, and the correlation is +0.38.E) None of the above choices is correct.(Source: http://www.cardinalnewsnetwork.org/south-kent-community/sleep-study-sks-style/)A set of n = 10 pairs of scores has ΣX = 20, ΣY = 30, and ΣXY = 74. What is the value of SP for these data?For each problem, select the best response. (a) In a scatterplot of the average price of a barrel of oil and the average retail price of a gallon of gasoline, you expect to see A. a positive association. B. very little association. C. a negative association. D. None of the above. (b) If the correlation between two variables is close to 0, you can conclude that a scatterplot would show A. a cloud of points with no visible pattern.B. no straight-line pattern, but there might be a strong pattern of another form. C. a strong straight-line pattern. D. None of the above. (c) You have data for many years on the average price of a barrel of oil and the average retail price of a gallon of unleaded regular gasoline. When you make a scatterplot, the explanatory variable on the x -axis A. is the price of gasoline. B. can be either oil price or gasoline price. C. is the price of oil. D. None of the above.
- In general, ___________% of the values in a data set lie at or below the 28 th percentile. _______________ % of the values in a data set lie at or above the 90 th percentile.. If a sample consists of 700 test scores, _________of them would be at or below the 52 th percentile. If a sample consists of 700 test scores, ________ of them would be at or above the 64 th percentile.For the following data, N=_x_fFor each of the following statements, indicate whether you believe the statement is true or false. If you correlate two quantitative variables, called “x” and “y,” the correlation will not change if you switch which variable is “x” and which is “y.” To compute r, both variables must be quantitative (or numerical). The correlation coefficient is not affected by outliers.
