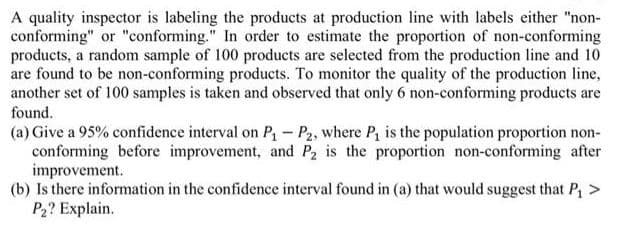
A quality inspector is labeling the products at production line with labels either "non- conforming" or "conforming." In order to estimate the proportion of non-conforming products, a random sample of 100 products are selected from the production line and 10 are found to be non-conforming products. To monitor the quality of the production line, another set of 100 samples is taken and observed that only 6 non-conforming products are found. (a) Give a 95% confidence interval on P1 - P2, where P, is the population proportion non- conforming before improvement, and P2 is the proportion non-conforming after improvement. (b) Is there information in the confidence interval found in (a) that would suggest that P, > P2? Explain.
A quality inspector is labeling the products at production line with labels either "non- conforming" or "conforming." In order to estimate the proportion of non-conforming products, a random sample of 100 products are selected from the production line and 10 are found to be non-conforming products. To monitor the quality of the production line, another set of 100 samples is taken and observed that only 6 non-conforming products are found. (a) Give a 95% confidence interval on P1 - P2, where P, is the population proportion non- conforming before improvement, and P2 is the proportion non-conforming after improvement. (b) Is there information in the confidence interval found in (a) that would suggest that P, > P2? Explain.

Holt Mcdougal Larson Pre-algebra: Student Edition 2012
1st Edition
ISBN:9780547587776
Author:HOLT MCDOUGAL
Publisher:HOLT MCDOUGAL
Chapter11: Data Analysis And Probability
Section: Chapter Questions
Problem 8CR

Related questions
Question
Please asap
Transcribed Image Text:A quality inspector is labeling the products at production line with labels either "non-
conforming" or "conforming." In order to estimate the proportion of non-conforming
products, a random sample of 100 products are selected from the production line and 10
are found to be non-conforming products. To monitor the quality of the production line,
another set of 100 samples is taken and observed that only 6 non-conforming products are
found.
(a) Give a 95% confidence interval on P - P2, where P, is the population proportion non-
conforming before improvement, and P2 is the proportion non-conforming after
improvement.
(b) Is there information in the confidence interval found in (a) that would suggest that P, >
P2? Explain.
Expert Solution
This question has been solved!
Explore an expertly crafted, step-by-step solution for a thorough understanding of key concepts.

Step by step
Solved in 2 steps

Knowledge Booster


Learn more about
Need a deep-dive on the concept behind this application? Look no further. Learn more about this topic, statistics and related others by exploring similar questions and additional content below.Recommended textbooks for you
Holt Mcdougal Larson Pre-algebra: Student Edition…
Algebra
ISBN:
9780547587776
Author:
HOLT MCDOUGAL
Publisher:
HOLT MCDOUGAL
Holt Mcdougal Larson Pre-algebra: Student Edition…
Algebra
ISBN:
9780547587776
Author:
HOLT MCDOUGAL
Publisher:
HOLT MCDOUGAL