A survey is conducted to determine if there is a difference in the proportion of students, parents, and Because the P-value of this test is large, there is not convincing evidence that the distribution of responses for the population of all students, parents, and teachers of this large high school differs. For which categories are the observed counts greater than teachers who volunteer at least once a month. To investigate, a random sample of 45 students, 25 parents, and 12 teachers was selected from a large high school. The data are displayed in the tables. expected?
A survey is conducted to determine if there is a difference in the proportion of students, parents, and Because the P-value of this test is large, there is not convincing evidence that the distribution of responses for the population of all students, parents, and teachers of this large high school differs. For which categories are the observed counts greater than teachers who volunteer at least once a month. To investigate, a random sample of 45 students, 25 parents, and 12 teachers was selected from a large high school. The data are displayed in the tables. expected?

MATLAB: An Introduction with Applications
6th Edition
ISBN:9781119256830
Author:Amos Gilat
Publisher:Amos Gilat
Chapter1: Starting With Matlab
Section: Chapter Questions
Problem 1P

Related questions
Question
Transcribed Image Text:A survey is conducted to determine if there is a
Because the P-value of this test is large, there is not
convincing evidence that the distribution of responses
for the population of all students, parents, and
teachers of this large high school differs. For which
categories are the observed counts greater than
expected?
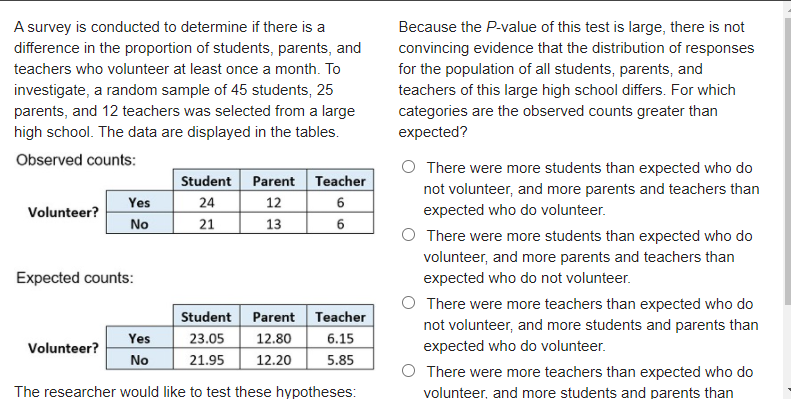
difference in the proportion of students, parents, and
teachers who volunteer at least once a month. To
investigate, a random sample of 45 students, 25
parents, and 12 teachers was selected from a large
high school. The data are displayed in the tables.
Observed counts:
O There were more students than expected who do
Student Parent Teacher
Yes
No
not volunteer, and more parents and teachers than
expected who do volunteer.
24
12
6
Volunteer?
21
13
6
There were more students than expected who do
volunteer, and more parents and teachers than
expected who do not volunteer.
Expected counts:
There were more teachers than expected who do
Student Parent Teacher
not volunteer, and more students and parents than
expected who do volunteer.
Yes
23.05
12.80
6.15
Volunteer?
No
21.95
12.20
5.85
There were more teachers than expected who do
The researcher would like to test these hypotheses:
volunteer, and more students and parents than
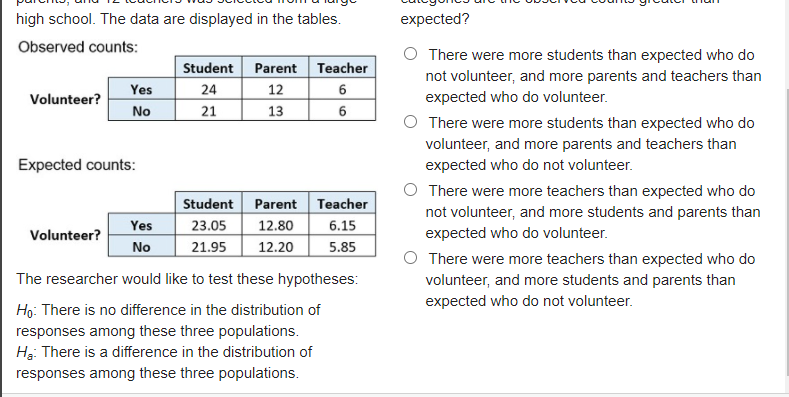
Transcribed Image Text:high school. The data are displayed in the tables.
expected?
Observed counts:
Student Parent Teacher
12
There were more students than expected who do
not volunteer, and more parents and teachers than
expected who do volunteer.
Yes
24
6
Volunteer?
No
21
13
6
There were more students than expected who do
volunteer, and more parents and teachers than
expected who do not volunteer.
Expected counts:
O There were more teachers than expected who do
Student Parent Teacher
not volunteer, and more students and parents than
expected who do volunteer.
12.80
Yes
No
23.05
6.15
Volunteer?
21.95
12.20
5.85
There were more teachers than expected who do
volunteer, and more students and parents than
expected who do not volunteer.
The researcher would like to test these hypotheses:
Ho: There is no difference in the distribution of
responses among these three populations.
Hạ: There is a difference in the distribution of
responses among these three populations.
Expert Solution
This question has been solved!
Explore an expertly crafted, step-by-step solution for a thorough understanding of key concepts.

This is a popular solution!

Trending now
This is a popular solution!

Step by step
Solved in 2 steps

Recommended textbooks for you
MATLAB: An Introduction with Applications
Statistics
ISBN:
9781119256830
Author:
Amos Gilat
Publisher:
John Wiley & Sons Inc

Probability and Statistics for Engineering and th…
Statistics
ISBN:
9781305251809
Author:
Jay L. Devore
Publisher:
Cengage Learning

Statistics for The Behavioral Sciences (MindTap C…
Statistics
ISBN:
9781305504912
Author:
Frederick J Gravetter, Larry B. Wallnau
Publisher:
Cengage Learning
MATLAB: An Introduction with Applications
Statistics
ISBN:
9781119256830
Author:
Amos Gilat
Publisher:
John Wiley & Sons Inc
Probability and Statistics for Engineering and th…
Statistics
ISBN:
9781305251809
Author:
Jay L. Devore
Publisher:
Cengage Learning
Statistics for The Behavioral Sciences (MindTap C…
Statistics
ISBN:
9781305504912
Author:
Frederick J Gravetter, Larry B. Wallnau
Publisher:
Cengage Learning

Elementary Statistics: Picturing the World (7th E…
Statistics
ISBN:
9780134683416
Author:
Ron Larson, Betsy Farber
Publisher:
PEARSON

The Basic Practice of Statistics
Statistics
ISBN:
9781319042578
Author:
David S. Moore, William I. Notz, Michael A. Fligner
Publisher:
W. H. Freeman

Introduction to the Practice of Statistics
Statistics
ISBN:
9781319013387
Author:
David S. Moore, George P. McCabe, Bruce A. Craig
Publisher:
W. H. Freeman