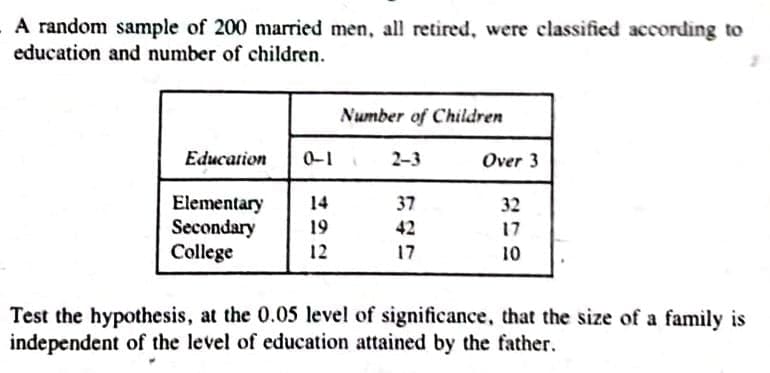
A random sample of 200 married men, all retired, were classified according to education and number of children. Number of Children Education 0-1 2-3 Over 3 Elementary Secondary College 14 37 32 17 19 42 12 17 10
Q: Suppose a random sample size of 60 is taken from a population with p = 0.51. What is the mean of…
A:
Q: The table shows a random sample of musicians and how they learned to play their instruments. Gender…
A: P(musician is a female AND had private instructor)
Q: listed. Treating them as (a) a sample and 8.5 5.2 4.1 3.4 9.8 6.5 6.8 8.0 3.9
A: Solution : The given data is 2.1, 2.8, 3.4, 3.7, 3.8, 3.9, 4.1, 4.5, 5.0, 5.2, 5.2, 5.8, 5.8, 5.8,…
Q: 2. The following table shows a random sample of 100 New Yorkers and their preferred restaurants:…
A: The two way contingency table represents two classifications of a set of counts or frequencies. The…
Q: 5. An advertising agency in a large city is conducting a survey of adults to investigate whether…
A: Since you have posted a question with multiple sub parts, we will solve first three sub parts for…
Q: In order to assess how students feel about using student fees to pay for a new parking lot, a…
A: The population the reporter is interested in is:
Q: 34. A sample of 10 NCAA college basketball game scores provided the following data (USA Today,…
A: Solution : Data is given in the form of Winning Team points, Losing Team points and Winning Margin.…
Q: Use the following table to answer the question. A random sample of college students was asked to…
A: Given : Total Male = 96 Total female = 104 Total students = 200 8) Probability of student randomly…
Q: SUMMARY Groups Count Sum Average Variance Barzini's 5 521 104,2 191,7…
A: The results (in dollars) of the survey are shown in the table below. Barzini’s Hwang’s Jack’s…
Q: You simulate the following 35 random values from a distribution: 7 11 14 15 17 18 19 25 29 30 34 38…
A: For the given sample values,
Q: The article "Facebook Use and Academic Performance Among College Students"† estimated that 87%…
A: It is given that the population proportion is 0.87. In the survey the sample proportion van be…
Q: The following table contains data from a random sample of 12 states and lists expenditures (in…
A:
Q: Each year, researchers at the U.S. Bureau of Labor Statistics (BLS) administer the American Time Use…
A: A researcher complied a random sample of 12 Americans and asked each person how much time they spent…
Q: Cans of food, stacked in a warehouse, are sampledto determine the proportion of damaged cans.…
A: From the given information, the cans of food is stacked in a warehouse are sampled to determine the…
Q: Is a statistics class' delivery type a factor in how well students do on the final exam? the average…
A: Null and alternative hypothesis: Ho: µ1 = µ2 = µ3 (All means are equal) Ha : At least two of the…
Q: A study of the career plans of young women and men sent questionnaires to all 722 members of the…
A: We want to tell what distribution is appropriate for this test
Q: The type of household for the U.S. population and for a random sample of 411 households from a…
A:
Q: een obesity: The 2013 National Youth Risk Behavior Survey (YRBS) reported that 13.7% of U.S.…
A:
Q: A television station wishes to study the relationship between viewership of its 11 p.m. news program…
A: p1 = 49/250 = 0.196 p4 = 81/250 = 0.336
Q: Each year, researchers at the U.S. Bureau of Labor Statistics (BLS) administer the American Time Use…
A: Given data: Confidence level = 99.9% Sample size = 16
Q: Mask?/Region East West North South Total Yes 249 212 213 207 881 No 92 89 72 64 317 Total 341 301…
A: Chi square test: Chi-square test for independence is used to the relationship between two variables…
Q: The test scores of 10 randomly selected students are listed below. Find the median. 30 35 43 44 47…
A:
Q: 5. A Mathematics faculty of a public university conducted a study among students enrolled in an…
A: Given: Student Hours Score 1 28 90 2 29 92 3 24 82 4 25 85 5 23 79 6 24 82 7 28 98…
Q: At a local community college, five statistics classes are randomly selected out of 20 and all of the…
A: In the given situation, we need to identify which sampling method is used.
Q: A university dean is interested in determining the proportion of students who receive some financial…
A:
Q: A businesswoman is considering whether to open a coffee shop in a local shopping center. Before…
A: Hence, the population mean is $21.84
Q: A businesswoman is considering whether to open a coffee shop in a local shopping center. Before…
A: Note: Thank you for the question. Since only 25 data values are given, we have obtained mean and…
Q: An advertising agency in a large city is conducting a survey of adults to investigate whether there…
A: The given summarized table is,
Q: A random sample of 12 pledges to a public radio fundraiser revealed the following dollar pledges: 75…
A: Range of a data set is the difference between the maximum and the minimum value. It is obtained by…
Q: 2.7 2.3 3.4 0.6 4.8 1.8 3.7 4.8 1.8 4.6 4.2 1.6 Determine the point estimate, x¯ and the sample…
A:
Q: 5. A Mathematics faculty of a public university conducted a study among students enrolled in an…
A: Correlation Coefficient: Let (x1, y1), (x2, y2), ... , (xn, yn) be n set of observations for the…
Q: Snoop Incorporated is a firm that does market surveys. The Rollum Sound Company hired Snoop to study…
A: Given - Part a) We have to find 1% level of significance So, level of…
Q: Each year, researchers at the U.S. Bureau of Labor Statistics (BLS) administer the American Time Use…
A: Given n=14
Q: The following data represents the number of rooms in a random sample of U.S. housing units. Rooms…
A: Rooms Frequency One 5 Two 11 Three 88 Four 183 Five 230 Six 204 Seven 123 Eight or…
Q: A businesswoman is considering whether to open a coffee shop in a local shopping center. Before…
A:
Q: Many airline passengers seem weighted down by their carry-on luggage. Just how much weight are they…
A: The data is given on the weights of luggage for 40 passengers. The stem and leaf plot has two main…
Q: A businesswoman is considering whether to open a coffee shop in a local shopping center. Before…
A:
Q: The following table is based on a random sample of people age 18 and older who said they were…
A: There are two categorical variables which are gender and bringing a laptop. Bringing a laptop has 2…
Q: The students in an Introductory Statistics class are asked to complete a survey about study habits.…
A: Simple random sampling: A simple random sample of size n is collected from a large population where…
Q: 14. Lightning Match Company's quality control department randomly sampled boxes to check the average…
A: Hello! As you have posted more than 3 sub parts, we are answering the first 3 sub-parts(mean, median…
Q: From this population data set: (3, 6, 9, 12, 18), how many possible samples with sample size of 3…
A:
Q: Forbes magazine published data on the best small firms in 2012. These were firms that had been…
A: The mean is calculated using the Excel software. After entering the data in cells A1 to A30 (there…
Q: School administrators wondered whether class size and grade achievement (in percent) were related. A…
A: Given data, X Y X*Y X*X Y*Y 15 85 1275 225 7225 10 90 900 100 8100 8 82 656 64 6724 20 80…
Q: 10. Is there a relationship between marital status and happiness? In the 2006 General Social Survey,…
A:
Q: The following data represent crime rates per 1000 population for a random sample of 46 Denver…
A: Given, data on crime rates for a randomly selected sample of 46 Denver neighborhoods. a.The steps…
Q: A researcher wishes to determine whether there is a difference in the average age of elementary…
A: The data for ages of elementary school, high school, and community college teachers is as given in…
Q: University Patents. The number of patents a university receives is an indicator of the research…
A: a)Step-by-step software procedure to draw stem and leaf plot using MINITAB software is as…
Q: 12. In a recent survey, 200 randomly-selected high school students were asked whether they would…
A: We have drawn a side-by-side bar chart to show the distribution given in the question.
Q: Each year, researchers at the U.S. Bureau of Labor Statistics (BLS) administer the American Time Use…
A: Given,sample size(n)=16
Q: survey, a random selection of 2,757 adults was asked whether they identified more strongly with…
A: Follow the procedure given below.
Trending now
This is a popular solution!
Step by step
Solved in 2 steps
- The Pge marker in Drosphilia population segregates on the X chromosome. A sample of 2082 flies yielded 967 females and 667 males with the Pge maerker (Pge +) and 102 females and 346 males lacking the marker (Pge-). Using the average allele frequencies in the two sexes, calculate the expected numbers for the phenotypic classes and determine if the population is in Hardy Weinberg Euilibrium using a chi squared test (Remeber that df=1 for X linked genes).A farming cooperative in Capetown buys wheat seeds for its farmer members from seed merchants. A particular seed merchant claims that their wheat seeds have at least an 80% germination rate. Before the farming cooperative will buy from this seed merchant, they want to verify this claim. A random sample of 320 wheat seeds supplied by this seed merchant was tested, and it was found that only 230 seeds germinated. Is there sufficient statistical evidence at the 3% significance level to justify the purchase of wheat seeds from this seed merchant? Use the p-value approach to conduct a hypothesis test for a single proportion, and report the findings to the Capetown farming cooperative.A researcher selected a sample of 268 former student athletes from a list of graduates of a large university. A total of 14% of the sample of athletes had earned graduate degrees as compared to 17% of all graduates. Is the difference statistically significant? Use α=.01. Be sure to use the five-step model in conducting the hypothesis test.
- A simple random sample of size n=200 drivers with a valid driver's license is asked if they drive an American-made automobile. Of the 200 drivers surveyed, 114responded that they drive an American-made automobile. Determine if a majority of those with a valid driver's license drive an American-made automobile at the α=0.05level of significance. Test statistic____? Pvalue_______?Defective Pacemakers Among 8834 cases of heart pacemaker malfunctions, 504 were found to be caused by firmware, which is software programmed into the device (based on data from “Pacemaker and ICD Generator Malfunctions,” by Maisel et al., Journal of the American Medical Association, Vol. 295, No. 16). If the firmware is tested in three different pacemakers randomly selected from this batch of 8834 and the entire batch is accepted if there are no failures, what is the probability that the firmware in the entire batch will be accepted? Is this procedure likely to result in the entire batch being accepted?A simple random sample of front-seat occupants involved in car crashes is obtained. Among 28242824 occupants not wearing seat belts, 3939 were killed. Among 76977697 occupants wearing seat belts, 1717 were killed. Use a 0.050.05 significance level to test the claim that seat belts are effective in reducing fatalities. Complete parts (a) through (c) below. a. Test the claim using a hypothesis test. Consider the first sample to be the sample of occupants not wearing seat belts and the second sample to be the sample of occupants wearing seat belts. What are the null and alternative hypotheses for the hypothesis test? A. Upper H 0H0: p 1p1equals=p 2p2 Upper H 1H1: p 1p1less than<p 2p2 B. Upper H 0H0: p 1p1not equals≠p 2p2 Upper H 1H1: p 1p1equals=p 2p2 C. Upper H 0H0: p 1p1equals=p 2p2 Upper H 1H1: p 1p1greater than>p 2p2 D. Upper H 0H0: p 1p1equals=p 2p2 Upper H 1H1: p 1p1not equals≠p 2p2 E. Upper H 0H0: p…
- A researcher has observed 500 vehicles at a stop in a suburban neighborhood and recorded the type of vehicle (sedan, hatchback, bakkie) and driver behavior ar the stop sign (complete stop, near stop, "ran" tha stop sign). At the 0.05 level of significance, could there be some relationship between driver behavior and the type of vehicle being driven? Define the null hypothesis and the alternative hypothesis.In 2016, the US Department of Agriculture established a “maximum acceptable” salmonella prevalence of 15.4 percent for chicken parts sampled at the end of a slaughterhouse’s kill line. 54 of the 154 largest chicken-slaughter facilities in the US failed to meet this standard in 2018. Assume that these results are representative for all large chicken-slaughter facilities. Suppose that in a random sample of 60 chicken parts from the large ACME chicken-slaughter facility (which produces 1,000,000 chicken parts per year), 45 chicken parts test negative for salmonella. c) Estimate the number of chicken parts that are needed for a follow-up study with 90% power to test thenull hypothesis that the prevalence of salmonella among chicken parts at the ACME facility is equal to the maximum acceptable value.In 2016, the US Department of Agriculture established a “maximum acceptable” salmonella prevalence of 15.4 percent for chicken parts sampled at the end of a slaughterhouse’s kill line. 54 of the 154 largest chicken-slaughter facilities in the US failed to meet this standard in 2018. Assume that these results are representative for all large chicken-slaughter facilities. Suppose that in a random sample of 60 chicken parts from the large ACME chicken-slaughter facility (which produces 1,000,000 chicken parts per year), 45 chicken parts test negative for salmonella. b) Estimate the number of facilities that are needed in a study to obtain 80% power to test the null hypothesis that the prevalence of failing to meet the chicken part salmonella standard among large chicken-slaughter facilities is 20%.
- In 2016, the US Department of Agriculture established a “maximum acceptable” salmonella prevalence of 15.4 percent for chicken parts sampled at the end of a slaughterhouse’s kill line. 54 of the 154 largest chicken-slaughter facilities in the US failed to meet this standard in 2018. Assume that these results are representative for all large chicken-slaughter facilities. Suppose that in a random sample of 60 chicken parts from the large ACME chicken-slaughter facility (which produces 1,000,000 chicken parts per year), 45 chicken parts test negative for salmonella. a) Test the null hypothesis that the prevalence of salmonella among ACME chicken parts is 15.4%, usingthe p-value method.From a sample of 100 each for part-time workers and full-time workers, it is found that 5 part-time workers and 15 full-time workers have filed a sick leave for at least 3 days in the past year. At significance levels of (a) 0.01 and (b) 0.05, test the hypothesis that the difference in work arrangement matters in the likelihood that the worker files a sick leave for at least 3 days. State the null and alternative hypothesis Compute the test statistic or the Z value State your conclusion at α=.05 State your conclusion at α=.01A medical researcher claims that 5% of children have asthma.In a random sample of 100 children 7.2% say they have asthma. At α=.05, evaluate the claim by: Identifying the claim and H0 and Ha, Finding the appropriate standardized test statistic, Finding the P-value or the rejection region, Deciding whether to reject or fail to reject the null hypothesis, and Interpreting the decision in the context of the original claim.