Create a Source Table using the information given to you in the following scenario: a new diet pill is being tested for effectiveness. Four groups of women are selected. Women in Group 1 (n = 10) are given 5 mg of the drug, those in Group 2 (n = 10) are given 10 mg, Group 3 (n=10) gets 15 mg, and Group 4 (n=10) receives a placebo. The women are asked to record the percentage of weight lost after taking the pill daily for 6 months. Sum of Squares (SS) Between = 263.2; SS Within = 365.2. Use your Source Table to indicate the results. Is F significant? If so, at what alpha level? !! %3!
Create a Source Table using the information given to you in the following scenario: a new diet pill is being tested for effectiveness. Four groups of women are selected. Women in Group 1 (n = 10) are given 5 mg of the drug, those in Group 2 (n = 10) are given 10 mg, Group 3 (n=10) gets 15 mg, and Group 4 (n=10) receives a placebo. The women are asked to record the percentage of weight lost after taking the pill daily for 6 months. Sum of Squares (SS) Between = 263.2; SS Within = 365.2. Use your Source Table to indicate the results. Is F significant? If so, at what alpha level? !! %3!

MATLAB: An Introduction with Applications
6th Edition
ISBN:9781119256830
Author:Amos Gilat
Publisher:Amos Gilat
Chapter1: Starting With Matlab
Section: Chapter Questions
Problem 1P

Related questions
Question
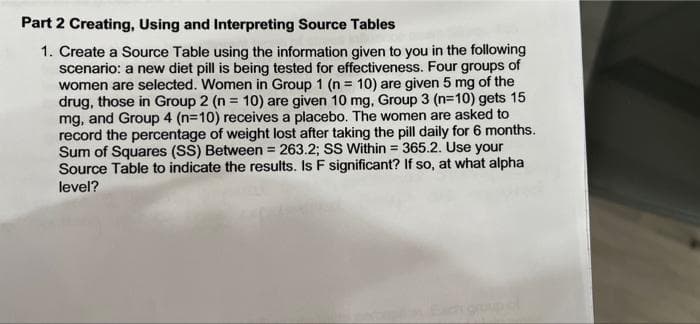
Transcribed Image Text:Part 2 Creating, Using and Interpreting Source Tables
1. Create a Source Table using the information given to you in the following
scenario: a new diet pill is being tested for effectiveness. Four groups of
women are selected. Women in Group 1 (n = 10) are given 5 mg of the
drug, those in Group 2 (n = 10) are given 10 mg, Group 3 (n=10) gets 15
mg, and Group 4 (n=10) receives a placebo. The women are asked to
record the percentage of weight lost after taking the pill daily for 6 months.
Sum of Squares (SS) Between = 263.2; SS Within = 365.2. Use your
Source Table to indicate the results. Is F significant? If so, at what alpha
level?
groupof
Expert Solution
This question has been solved!
Explore an expertly crafted, step-by-step solution for a thorough understanding of key concepts.

Step by step
Solved in 3 steps with 2 images

Recommended textbooks for you
MATLAB: An Introduction with Applications
Statistics
ISBN:
9781119256830
Author:
Amos Gilat
Publisher:
John Wiley & Sons Inc

Probability and Statistics for Engineering and th…
Statistics
ISBN:
9781305251809
Author:
Jay L. Devore
Publisher:
Cengage Learning

Statistics for The Behavioral Sciences (MindTap C…
Statistics
ISBN:
9781305504912
Author:
Frederick J Gravetter, Larry B. Wallnau
Publisher:
Cengage Learning
MATLAB: An Introduction with Applications
Statistics
ISBN:
9781119256830
Author:
Amos Gilat
Publisher:
John Wiley & Sons Inc
Probability and Statistics for Engineering and th…
Statistics
ISBN:
9781305251809
Author:
Jay L. Devore
Publisher:
Cengage Learning
Statistics for The Behavioral Sciences (MindTap C…
Statistics
ISBN:
9781305504912
Author:
Frederick J Gravetter, Larry B. Wallnau
Publisher:
Cengage Learning

Elementary Statistics: Picturing the World (7th E…
Statistics
ISBN:
9780134683416
Author:
Ron Larson, Betsy Farber
Publisher:
PEARSON

The Basic Practice of Statistics
Statistics
ISBN:
9781319042578
Author:
David S. Moore, William I. Notz, Michael A. Fligner
Publisher:
W. H. Freeman

Introduction to the Practice of Statistics
Statistics
ISBN:
9781319013387
Author:
David S. Moore, George P. McCabe, Bruce A. Craig
Publisher:
W. H. Freeman