A random sample of 49 measurements from a population with population standard deviation ?1 = 3 had a sample mean of x1 = 11. An independent random sample of 64 measurements from a second population with population standard deviation ?2 = 4 had a sample mean of x2 = 13. Test the claim that the population means are different. Use level of significance 0.01.
A random sample of 49 measurements from a population with population standard deviation ?1 = 3 had a sample mean of x1 = 11. An independent random sample of 64 measurements from a second population with population standard deviation ?2 = 4 had a sample mean of x2 = 13. Test the claim that the population means are different. Use level of significance 0.01.

MATLAB: An Introduction with Applications
6th Edition
ISBN:9781119256830
Author:Amos Gilat
Publisher:Amos Gilat
Chapter1: Starting With Matlab
Section: Chapter Questions
Problem 1P

Related questions
Question
A random sample of 49 measurements from a population with population standard deviation ?1 = 3 had a sample mean of x1 = 11. An independent random sample of 64 measurements from a second population with population standard deviation ?2 = 4 had a sample mean of x2 = 13. Test the claim that the population means are different. Use level of significance 0.01.
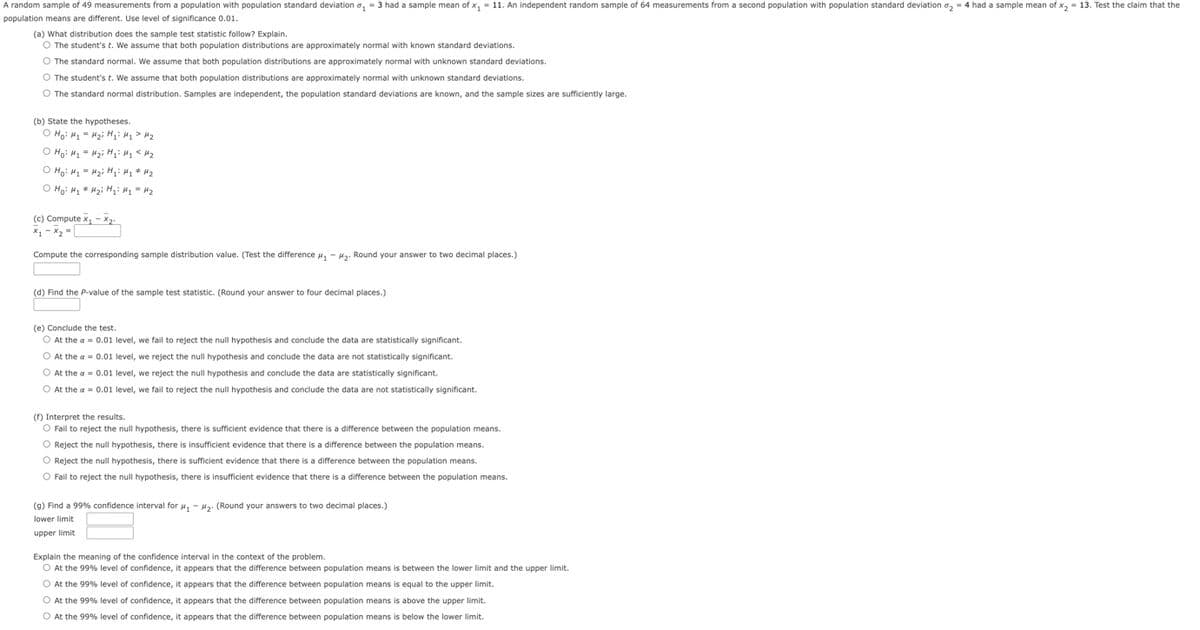
Transcribed Image Text:A random sample of 49 measurements from a population with population standard deviation ₁-3 had a sample mean of x₁ = 11. An independent random sample of 64 measurements from a second population with population standard deviation ₂ = 4 had a sample mean of x₂ = 13. Test the claim that the
population means are different. Use level of significance 0.01.
(a) What distribution does the sample test statistic follow? Explain.
O The student's t. We assume that both population distributions are approximately normal with known standard deviations.
O The standard normal. We assume that both population distributions are approximately normal with unknown standard deviations.
O The student's t. We assume that both population distributions are approximately normal with unknown standard deviations.
O The standard normal distribution. Samples are independent, the population standard deviations are known, and the sample sizes are sufficiently large.
(b) State the hypotheses.
O Ho: H₂H₂i H₁
H₂> H₂
O Ho: H₁ H₂i H₁ H₂ <H₂
о но на = Hzi H1 H1 * H2
о но на * Hzi Hi: H1 H2
(c) Compute x₁-x₂.
x₁ - x₂ =
Compute the corresponding sample distribution value. (Test the difference #₁ - M₂. Round your answer to two decimal places.)
(d) Find the P-value of the sample test statistic. (Round your answer to four decimal places.)
(e) Conclude the test.
O At the a = 0.01 level, we fail to reject the null hypothesis and conclude the data are statistically significant.
O At the a = 0.01 level, we reject the null hypothesis and conclude the data are not statistically significant.
O At the a= 0.01 level, we reject the null hypothesis and conclude the data are statistically significant.
O At the a = 0.01 level, we fail to reject the null hypothesis and conclude the data are not statistically significant.
(f) Interpret the results.
O Fail to reject the null hypothesis, there is sufficient evidence that there is a difference between the population means.
O Reject the null hypothesis, there is insufficient evidence that there is a difference between the population means.
O Reject the null hypothesis, there is sufficient evidence that there is a difference between the population means.
O Fail to reject the null hypothesis, there is insufficient evidence that there is a difference between the population means.
(9) Find a 99% confidence interval for μ₁ - #₂. (Round your answers to two decimal places.)
lower limit
upper limit
Explain the meaning of the confidence interval in the context of the problem.
O At the 99% level of confidence, it appears that the difference between population means is between the lower limit and the upper limit.
O At the 99% level of confidence, it appears that the difference between population means is equal to the upper limit.
O At the 99% level of confidence, it appears that the difference between population means
O At the 99% level of confidence, it appears that the difference between population means
above the upper limit.
below the lower limit.
Expert Solution
This question has been solved!
Explore an expertly crafted, step-by-step solution for a thorough understanding of key concepts.

Step by step
Solved in 6 steps with 4 images

Recommended textbooks for you
MATLAB: An Introduction with Applications
Statistics
ISBN:
9781119256830
Author:
Amos Gilat
Publisher:
John Wiley & Sons Inc

Probability and Statistics for Engineering and th…
Statistics
ISBN:
9781305251809
Author:
Jay L. Devore
Publisher:
Cengage Learning

Statistics for The Behavioral Sciences (MindTap C…
Statistics
ISBN:
9781305504912
Author:
Frederick J Gravetter, Larry B. Wallnau
Publisher:
Cengage Learning
MATLAB: An Introduction with Applications
Statistics
ISBN:
9781119256830
Author:
Amos Gilat
Publisher:
John Wiley & Sons Inc
Probability and Statistics for Engineering and th…
Statistics
ISBN:
9781305251809
Author:
Jay L. Devore
Publisher:
Cengage Learning
Statistics for The Behavioral Sciences (MindTap C…
Statistics
ISBN:
9781305504912
Author:
Frederick J Gravetter, Larry B. Wallnau
Publisher:
Cengage Learning

Elementary Statistics: Picturing the World (7th E…
Statistics
ISBN:
9780134683416
Author:
Ron Larson, Betsy Farber
Publisher:
PEARSON

The Basic Practice of Statistics
Statistics
ISBN:
9781319042578
Author:
David S. Moore, William I. Notz, Michael A. Fligner
Publisher:
W. H. Freeman

Introduction to the Practice of Statistics
Statistics
ISBN:
9781319013387
Author:
David S. Moore, George P. McCabe, Bruce A. Craig
Publisher:
W. H. Freeman