A random sample of 79 eighth grade students' scores on a national mathematics assessment test has a mean score of 263. This test result prompts a state school administrator to declare that the mean score for the state's eighth graders on this exam is more than 260. Assume that the population standard deviation is 34. At a = 0.05, is there enough evidence to support the administrator's claim? Complete parts (a) through (e). (a) Write the claim mathematically and identify Ho and Ha. Choose the correct answer below. Ο Α. H : με 260 (claim) H:u< 260 O B. Ho: us260 (claim) H:p> 260 OC. Ho: = 260 (claim) H:u> 260 O E. Ho: us260 O D . H : μ 260 Ha:> 260 (claim) ΟΕ Hρ: μ< 260 H:u2 260 (claim) H:u> 260 (claim) (b) Find the standardized test statistic z, and its corresponding area. z= (Round to two decimal places as needed.) (c) Find the P-value. P-value = (Round to three decimal places as needed.) (d) Decide whether reject or fail to reject the null hypothesis. O Fail to reject Ho O Reject Ho (e) Interpret your decision in the context of the original claim. At the 5% significance level, there V enough evidence to V the administrator's claim that the mean score for the state's eighth graders on the exam is more than 260.
A random sample of 79 eighth grade students' scores on a national mathematics assessment test has a mean score of 263. This test result prompts a state school administrator to declare that the mean score for the state's eighth graders on this exam is more than 260. Assume that the population standard deviation is 34. At a = 0.05, is there enough evidence to support the administrator's claim? Complete parts (a) through (e). (a) Write the claim mathematically and identify Ho and Ha. Choose the correct answer below. Ο Α. H : με 260 (claim) H:u< 260 O B. Ho: us260 (claim) H:p> 260 OC. Ho: = 260 (claim) H:u> 260 O E. Ho: us260 O D . H : μ 260 Ha:> 260 (claim) ΟΕ Hρ: μ< 260 H:u2 260 (claim) H:u> 260 (claim) (b) Find the standardized test statistic z, and its corresponding area. z= (Round to two decimal places as needed.) (c) Find the P-value. P-value = (Round to three decimal places as needed.) (d) Decide whether reject or fail to reject the null hypothesis. O Fail to reject Ho O Reject Ho (e) Interpret your decision in the context of the original claim. At the 5% significance level, there V enough evidence to V the administrator's claim that the mean score for the state's eighth graders on the exam is more than 260.

MATLAB: An Introduction with Applications
6th Edition
ISBN:9781119256830
Author:Amos Gilat
Publisher:Amos Gilat
Chapter1: Starting With Matlab
Section: Chapter Questions
Problem 1P

Related questions
Topic Video
Question
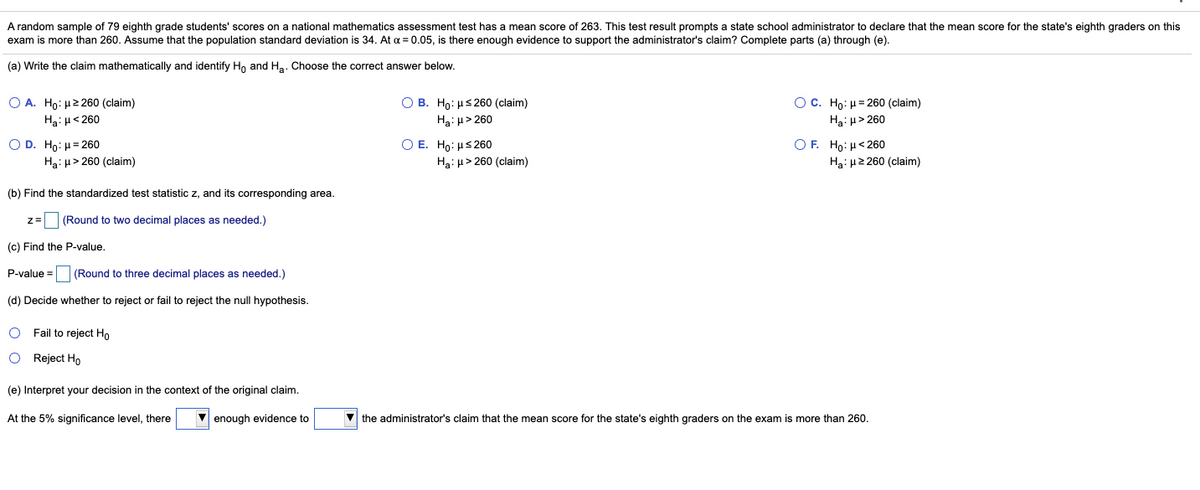
Transcribed Image Text:A random sample of 79 eighth grade students' scores on a national mathematics assessment test has a mean score of 263. This test result prompts a state school administrator to declare that the mean score for the state's eighth graders on this
exam
s more than 260. Assume that the population standard deviation is 34. At a = 0.05, is there enough evidence to support the administrator's claim? Complete parts (a) through (e).
(a) Write the claim mathematically and identify Ho and Ha. Choose the correct answer below.
OC. Ho: H= 260 (claim)
Ο Α. H με 260 (claim)
Ha: H< 260
O B. Ho: us 260 (claim)
Ha: u> 260
Ha: u> 260
O E. Ho: us 260
Ha: u> 260 (claim)
OF. Ho: H< 260
Ha: µ2 260 (claim)
O D. Ho: H = 260
Ha: H> 260 (claim)
(b) Find the standardized test statistic z, and its corresponding area.
z=
(Round to two decimal places as needed.)
(c) Find the P-value.
P-value =
(Round to three decimal places as needed.)
(d) Decide whether to reject or fail to reject the null hypothesis.
Fail to reject Ho
O Reject Ho
(e) Interpret your decision in the context of the original claim.
At the 5% significance level, there
enough evidence to
the administrator's claim that the mean score for the state's eighth graders on the exam is more than 260.
Expert Solution
This question has been solved!
Explore an expertly crafted, step-by-step solution for a thorough understanding of key concepts.

This is a popular solution!

Trending now
This is a popular solution!

Step by step
Solved in 6 steps with 6 images

Knowledge Booster


Learn more about
Need a deep-dive on the concept behind this application? Look no further. Learn more about this topic, statistics and related others by exploring similar questions and additional content below.Recommended textbooks for you
MATLAB: An Introduction with Applications
Statistics
ISBN:
9781119256830
Author:
Amos Gilat
Publisher:
John Wiley & Sons Inc

Probability and Statistics for Engineering and th…
Statistics
ISBN:
9781305251809
Author:
Jay L. Devore
Publisher:
Cengage Learning

Statistics for The Behavioral Sciences (MindTap C…
Statistics
ISBN:
9781305504912
Author:
Frederick J Gravetter, Larry B. Wallnau
Publisher:
Cengage Learning
MATLAB: An Introduction with Applications
Statistics
ISBN:
9781119256830
Author:
Amos Gilat
Publisher:
John Wiley & Sons Inc
Probability and Statistics for Engineering and th…
Statistics
ISBN:
9781305251809
Author:
Jay L. Devore
Publisher:
Cengage Learning
Statistics for The Behavioral Sciences (MindTap C…
Statistics
ISBN:
9781305504912
Author:
Frederick J Gravetter, Larry B. Wallnau
Publisher:
Cengage Learning

Elementary Statistics: Picturing the World (7th E…
Statistics
ISBN:
9780134683416
Author:
Ron Larson, Betsy Farber
Publisher:
PEARSON

The Basic Practice of Statistics
Statistics
ISBN:
9781319042578
Author:
David S. Moore, William I. Notz, Michael A. Fligner
Publisher:
W. H. Freeman

Introduction to the Practice of Statistics
Statistics
ISBN:
9781319013387
Author:
David S. Moore, George P. McCabe, Bruce A. Craig
Publisher:
W. H. Freeman