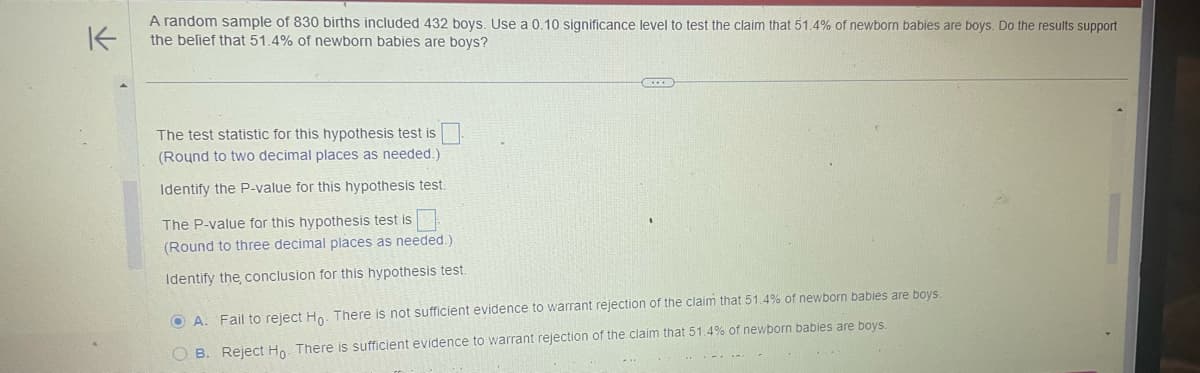
A random sample of 830 births included 432 boys. Use a 0.10 significance level to test the claim that 51.4% of newborn babies are boys. Do the results support the belief that 51.4% of newborn babies are boys? The test statistic for this hypothesis test is (Round to two decimal places as needed.) Identify the P-value for this hypothesis test. The P-value for this hypothesis test is (Round to three decimal places as needed.) Identify the conclusion for this hypothesis test. A. Fail to reject Ho. There is not sufficient evidence to warrant rejection of the claim that 51.4% of newborn babies are boys. OB. Reject Ho. There is sufficient evidence to warrant rejection of the claim that 51.4% of newborn babies are boys.
Q: A newspaper published an article about a study in which researchers subjected laboratory gloves to…
A: From the provided information, n1=244p^1=0.69n2=244p^2=0.11 Level of significance (α) = 0.10
Q: QUESTION 2 The symbol used for the variance of the sample is 00 b. 02. C. S. d. s2.
A: a) population standard Deviation = σ b) Population Variance = σ2 c) Sample standard Derivation = s…
Q: 1. You are back in quality control again, at a factory which produces 2000 products per day. Your…
A: Hypothesis testing are used to compare the sample and population. It has two types of testing, they…
Q: VS For each 6. Suppose the hypotheses for a statistical test are possible confidence interval given…
A: By using the confidence interval to find the value of significance level
Q: se the z-score formula, z=x−μ/σ, and the information below to find the mean, μ. Round your answer to…
A: z score =x-μσZ=3.25x=22.1σ=2.4x=?
Q: d. Find the distribution e. Find the distribution of I(X 6).
A: Please find the explanation below. Thank you.
Q: Use the given data set to complete parts (a) through (c) below. (Use a = 0.05.) 13 8.73 X y UM AY…
A: By using excel regression Excel > data> data analysis> regression > input data >…
Q: Match these values of r with the accompanying scatterplots: 0.384, 0.721, -0.384, -1, and -0.721.…
A: Solution: Scatter Plot: Scatter plot is a visualization technique which is used to determine the…
Q: escribe the correlations between the variables in these graphs in terms of: direction (positive or…
A: Given, correlation coefficient graphs C,D and E.
Q: A toy manufacturer wants to see how long, on average, a new toy captures children's attention. He…
A: given data, n=16X¯=27S=8normal distribution, CI=0.90α=1-0.90=0.10
Q: QUESTION 21 In simple linear regression, r2 is the a. mean square error. O b. correlation…
A: Correlation may be defined as the linear relationship between the two variables. It is denoted by r.…
Q: Wire electrical-discharge machining (WEDM) is a process used to manufacture conductive hard metal…
A: Method: by using the critical value of chi-square to find the confidence interval for standard…
Q: A health scientist is testing the effectiveness of three different diets (Diet A, Diet B, and Diet…
A: Here the researcher wants to test if the means of the three groups are equal or not.
Q: Management proposed the following regression model to predict sales at a fast-food outlet. y =B₁ +…
A: The estimated regression equation that predicts sales at a fast-food outlet…
Q: /var/app/current/assess2/questions/Question HtmlGenerator.php (203) : eval()'d code Suppose that, on…
A: Method: The sample size is large and population standard deviation is known, so we use to z test…
Q: 39. Perturbing a Poisson process. Let II be the set of points in a Poisson process on Rd with…
A:
Q: se technology to find the P-value for the hypothesis test described below. The claim is that for…
A: given data, claim:μ=16.00n=12df=n-1=12-1=11t=2.292p-value =?
Q: A farmer has two types of beans and wants to determine which produces a better bean of greater…
A: Given The data is as follows: Nutritional content Genotype High Low bb 8 4 Bb 6 2
Q: Worksheet #10 An analyst for a shopping district would like to determine the rent that should be…
A: As per our guidelines I can solve only first three 3 subparts. Kindly post the remaining subparts…
Q: You want to obtain a sample to estimate a population proportion. At this point in time, you have no…
A: given data 99% ci for pE = 0.01n = ?
Q: In a random sample of 200 students at a university, 160 stated that they were nonsmokers. Based on…
A: given data, n=200x= no. of smokers =160p^=xn=160200=0.80CI=0.95α=1-0.95=0.05
Q: Two or more random samples are considered independent if _________ .
A: Given: Two or more random samples are considered independent if:
Q: A company produces a type of fruit-filled chocolate called Choc-pricots. They are produced on an…
A: given data P(imfected) = p = 0.15sample size (n) = 80x = no. of choc-pricots imfectedP(x=X) =…
Q: Compute the linear correlation coefficient with the additional data point. The linear correlation…
A: The table shows the x and y values and the additional data point is (10.5, 9.4)
Q: Suppose Z follows the standard normal distribution. Use the calculator provided, or this table, to…
A: given data Z follows the stanadard normal curve we have to find out the value of c for the given…
Q: A researcher wishes to estimate the proportion of X-ray machines that malfunction. A random sample…
A: Given: n = 225 X = 54 Confidence level = 99% = 0.99 Formula Used: Confidence interval = p ±…
Q: The estimated regression equation for a model involving two independent variables and 10…
A: Solution: The estimated multiple regression equation is y^ =29.1570+0.5509x1+0.4940x2
Q: f) Compute the residuals. Which point has the residual with the largest magnitude? g) Compute the…
A: Given data: x y 136 89 118 85 116 83 126 84 122 74 121 90 135 84 119 79 136 97…
Q: Time can be expressed on different levels of scale, including days, weeks, months, and years. Can…
A: The sample size for group 30/31 days is 177 and sample size for group 1 month is 90.
Q: Give a point estimate of p1 Give the 95% confidence interval for p1 Give a point estimate of p1 − p2…
A: It is given that n1 = 194 n2 = 162 y1 = 28 y2 = 11
Q: Question 5. a) A random variable x has a Binomial distribution with n=12. Given that p =0.25, find…
A: Given that X ~ B(12,0.25) We have to find a...P(X<5) P(X≥7) b...If P(X=0)=0.05 We have to…
Q: The following data lists the ages of a random selection of actresses when they won an award in the…
A:
Q: You are conducting a study to see if the proportion of voters who prefer Candidate A is…
A: GIVEN data, conducting a study to see if the proportion of voters who prefer candidate A is…
Q: ok Assume the sample is taken from a normally distributed population. Construct 90% confidence…
A:
Q: Suppose the linear relationship between traffic violations and auto insurance premium has SSR of…
A: given data SSR = 2825 SST = 3150
Q: dentify the null and alternative hypotheses for this test. Choose the correct answer below. A. Ho:…
A: given data claim : p = 0.10n = 393x = 30α = 0.05
Q: Suppose you want to test the following hypotheses: Ho: μ = 50 vs. Ha:μ> 50, using an observed sample…
A: Note- Since you have posted multiple questions, as per our guidelines we are supposed to answer only…
Q: est the hypothesis that 0₁ 0₂ at the a= 0.01 level significance for the given sample data. Assume at…
A: The level of significance is 0.01.
Q: Suppose that 144 out of a random sample of 200 letters mailed in the United States were delivered…
A: It is given that Favourable cases, X = 144 Sample size, n = 200 Confidence interval = 95%
Q: A random sample of 33 professional baseball salaries from 1985 through 2015 was selected. The league…
A: The data shows the salaries for 33 professional baseball salaries from 1985 through 2015 was…
Q: botanist wishes to estimate the typical number of seeds for a certain fruit. She samples 67…
A: given data, n=67X¯=17.7S=13.5CI=0.99α=1-0.99=0.01
Q: 1- g Two different simple random samples are drawn from two different populations. The first sample…
A: Given that: 1st sample: n1=40x1=19 2nd sample: n2=2200x2=1543 where x1 and x2 are success…
Q: Pass the ball: The following table lists the heights (inches) and weights (pounds) of 8 National…
A: By using excel regression Excel> data>data analysis > regression > input data >…
Q: PLEASE HELP WITH THE PROBLEM BELOW Let pm and pf be the respective proportions of male and female…
A: Given X1=124, n1=894 X2=70, n2=700
Q: Design EITHER a randomized comparative experiment OR a matched pairs experiment, ap- propriately…
A: Randomized Comparative Experiment: The experiment treated as randomized comparative experiment if…
Q: was determined for 18 randomly selected insulin-dependent diabetics. ASSUME these 18 individuals…
A:
Q: The mean starting salary offered to graduating students with a certain major in a recent year was…
A: Given Population mean μ=64230, standard deviations σ=3643 n=75
Q: Suppose Z follows the standard normal distribution. Calculate the following probabilities using the…
A: The random variable Z is a standard normal variable. The standard normal distribution has a mean of…
Q: Testing: H0:μ ≤ 26.71 HA:μ > 26.71 Your sample consists of 47 subjects, with a mean of 27.2 and…
A: Given,sample size(n)=47sample mean(x¯)=27.2sample standard deviation(s)=1.78H0:μ≤26.71HA:μ>26.71…
Q: The mean calories of people who eat fast food with the sample size 126. Test the hypothesis that the…
A: Given: n = 126 μ = 500 X = 532.4920635 s = 250.8442942 α = 5% = 0.05 Formula Used: Test-statistict t…
Trending now
This is a popular solution!
Step by step
Solved in 3 steps with 1 images
- What is meant by the sample space of an experiment?A random sample of 865 births included 429 boys. Use a 0.01 significance level to test the claim that 51.3% of newborn babies are boys. Do the results support the belief that 51.3% of newborn babies are boys? Identify the P-value for this hypothesis test. The P-value for this hypothesis test isA random sample of 876 births include 432 boys. Use a 0.10 significance level to test the claim that 51.3% of newborn babies are boys. Do the results support the belief that 51.3% of newborn babies are boys? Identify the null and alternative hypothesis for the test. What is the test statistic for this hypothesis test? (Round to two decimal places) What is the P value? (Round to three decimal places) Identify the conclusion to the hypothesis test. Do the results support the belief that 51.3% of newborn babies are boys?
- The drug Ritalin is designed to stimulate the central nervous system. In a random sample of 252 boys aged ten – twelve years old, it was found that 44 of the boys were taking Ritalin. It is known that the proportion of all boys aged 13 – 15 who take Ritalin is 24%. A researcher claims that the population proportions of boys who take Ritalin aged 10 – 12 is different than boys aged 13 – 15. Can you support this claim at the 5% significance level? a. Conduct a hypothesis test to test the claim at the 5% significance level. Be sure to state you Ho and Ha, your test statistic and p-value, whether or not you reject Ho and whether you support the claim. b. Show that you can use the large sample methodology. c. Write a complete sentence describing what a Type I error is in context.In a study of 779 randomly selected medical malpractice lawsuits it was found that 515 of them were dropped or dismissed. Use a 0.05 significance level to test the claim that most medical malpractice lawsuits are dropped or dismissed. Which of the following is the hypothesis test to be conducted? What is the test statistic? Round to 2 decimal places. What is the P value? Round to 3 decimal places. What is the conclusion about the null hypothesis? What is the final conclusion?Consider a drug testing company that provides a test for marijuana usage. Among 322 tested subjects, results from 27 subjects were wrong (either a false positive or a false negative). Use a 0.05 significance level to test the claim that less than 10 percent of the test results are wrong. What is the null and alternative hypotheses for this test? What is the Test statistic? What is the P Value? What is the conclusion for this hypothesis test?
- Consider a drug testing company that provides a test for marijuana usage. Among 307 tested subjects, results from 27 subjects were wrong (either a false positive or a false negative). Use a 0.10 significance level to test the claim that less than 10 percent of the test results are wrong. what is the test stastic for hypothesis test? what is the p value of hypothesis test? reject or fail to reject and why?in a study of 825 randomly selected medical malpractice lawsuits, it was found that 512 of them were dropped or dismissed. Use a 0.01 significance level to test the claim that most medical malpractice lawsuits are dropped or dismissed. = > What is the test statistic? z= __ (round to two decimal places as needed) What is the P-value? P-value=___ (round to three decimal places as needed) What is the conclusion about the null hypothesis? What is the final conclusion?In a recent poll, 810 adults were asked to identify their favorite seat when they fly, and 495 of them chose a window seat. Use a 0.01 significance level to test the claim that the majority of adults prefer window seats when they fly. Identify the null hypothesis, alternative hypothesis, test statistic, P-value, conclusion about the null hypothesis, and final conclusion that addresses the original claim. Which of the following is the hypothesis test to be conducted? A. H0: p>0.5 H1: p=0.5 B. H0: p≠0.5 H1: p=0.5 C. H0: p=0.5 H1: p>0.5 D. H0: p<0.5 H1: p=0.5 E. H0: p=0.5 H1: p≠0.5 F. H0: p=0.5 H1: p<0.5 What is the test statistic? z= (Round to two decimal places as needed.) What is the P-value? P-value= (Round to four decimal places as needed.) What is the conclusion about the null hypothesis? A. Reject the null hypothesis in favor of the alternative hypothesis because the p-value is greater than…
- Consider a drug testing company that provides a test for marijuana usage. Among 253 tested subjects, results from 30 subjects were wrong (either a false positive or a false negative). Use a 0.01 significance level to test the claim that less than 10 percent of the test results are wrong. The test statistic for this hypothesis test is? The P-value for this hypothesis test?What type of hypothesis test should be performed? Ex: Left-tailed z-test, Left-tailed t-test, Right-tailed t-test, or a Two-tailed z-test. What is the test statistic? Ex: 0.12 Does sufficient evidence exist to support the claim that the voltage of the batteries made by the two manufacturers is different at the a = 0.05 significance level? Ex: yes or noConsider a sample of 47 football games, where 29 of them were won by the home team. Use a 0.05 significance level to test the claim that the probability that the home team wins is greater than one-half. Identify the test statistic for this hypothesis test. (round to two decimal places as needed) Identify P Value. (round to three decimal places as needed) Identify the conclusion for this hypothesis test. A. Fail to reject H0. There is not sufficient evidence to support the claim that the probability of the home team winning is greater than one-half. B. Fail to reject H0. There is sufficient evidence to support the claim that the probability of the home team winning is greater than one-half. C. Reject H0. There is not sufficient evidence to support the claim that the probability of the home team winning is greater than one-half. D. Reject H0. There is sufficient evidence to support the claim that the probability of the home team winning is greater than…