A random sample of 85 graduate level classes was selected and the number of enrolled students during the fall 2017 semester was recorded for each. The data is displayed in the boxplot below. Use this boxplot to completely describe the distribution of the number of enrolled students in this sample of 85 graduate level classes. 0 24 6 8 10 12 14 36 38 40 16 18 20 22 24 26 28 30, 32 34 Number of Enrolled Students a. Center is 10, Spread is 7, Skewed right, outliers of 30 and 36 a. Center at 10, Spread of 7, Skewed right, 36 is the outlier a. Center at 10, Spread is 23, Skewed right, outliers of 30 and 36 a. Center at 10, Spread 7, Skewed right, no outliers
A random sample of 85 graduate level classes was selected and the number of enrolled students during the fall 2017 semester was recorded for each. The data is displayed in the boxplot below. Use this boxplot to completely describe the distribution of the number of enrolled students in this sample of 85 graduate level classes. 0 24 6 8 10 12 14 36 38 40 16 18 20 22 24 26 28 30, 32 34 Number of Enrolled Students a. Center is 10, Spread is 7, Skewed right, outliers of 30 and 36 a. Center at 10, Spread of 7, Skewed right, 36 is the outlier a. Center at 10, Spread is 23, Skewed right, outliers of 30 and 36 a. Center at 10, Spread 7, Skewed right, no outliers

Glencoe Algebra 1, Student Edition, 9780079039897, 0079039898, 2018
18th Edition
ISBN:9780079039897
Author:Carter
Publisher:Carter
Chapter10: Statistics
Section10.4: Distributions Of Data
Problem 19PFA

Related questions
Question
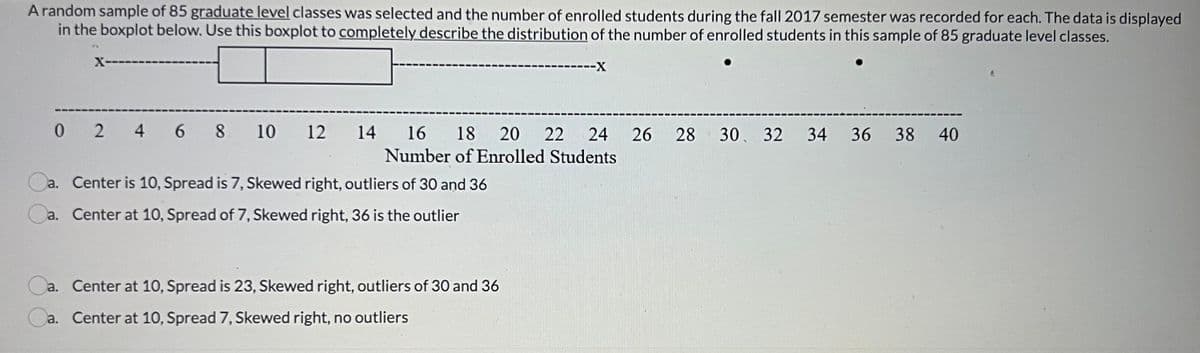
Transcribed Image Text:A random sample of 85 graduate level classes was selected and the number of enrolled students during the fall 2017 semester was recorded for each. The data is displayed
in the boxplot below. Use this boxplot to completely describe the distribution of the number of enrolled students in this sample of 85 graduate level classes.
92
X------
------X
30 32 34 36 38 40
0 2 4 6 8 10 12 14 16 18 20 22 24 26 28
Number of Enrolled Students
a. Center is 10, Spread is 7, Skewed right, outliers of 30 and 36
a. Center at 10, Spread of 7, Skewed right, 36 is the outlier
Ca.
a.
Center at 10, Spread is 23, Skewed right, outliers of 30 and 36
Ca.
a. Center at 10, Spread 7, Skewed right, no outliers
Expert Solution
This question has been solved!
Explore an expertly crafted, step-by-step solution for a thorough understanding of key concepts.

This is a popular solution!

Trending now
This is a popular solution!

Step by step
Solved in 2 steps

Recommended textbooks for you
Glencoe Algebra 1, Student Edition, 9780079039897…
Algebra
ISBN:
9780079039897
Author:
Carter
Publisher:
McGraw Hill

Algebra & Trigonometry with Analytic Geometry
Algebra
ISBN:
9781133382119
Author:
Swokowski
Publisher:
Cengage
Glencoe Algebra 1, Student Edition, 9780079039897…
Algebra
ISBN:
9780079039897
Author:
Carter
Publisher:
McGraw Hill
Algebra & Trigonometry with Analytic Geometry
Algebra
ISBN:
9781133382119
Author:
Swokowski
Publisher:
Cengage