stion 6 According to National Testing data, college math class testing times are Normally distributed with a mean of 49 minutes and standard deviation 6 minutes. The bell curve below represents the probability distribution for testing times. The scale on the horizontal axis is equal to the standard deviation. Fill in the three indicated boxes. μ = 49 σ = 6 Question Help: Video Submit Question
stion 6 According to National Testing data, college math class testing times are Normally distributed with a mean of 49 minutes and standard deviation 6 minutes. The bell curve below represents the probability distribution for testing times. The scale on the horizontal axis is equal to the standard deviation. Fill in the three indicated boxes. μ = 49 σ = 6 Question Help: Video Submit Question

Glencoe Algebra 1, Student Edition, 9780079039897, 0079039898, 2018
18th Edition
ISBN:9780079039897
Author:Carter
Publisher:Carter
Chapter10: Statistics
Section10.4: Distributions Of Data
Problem 19PFA

Related questions
Question
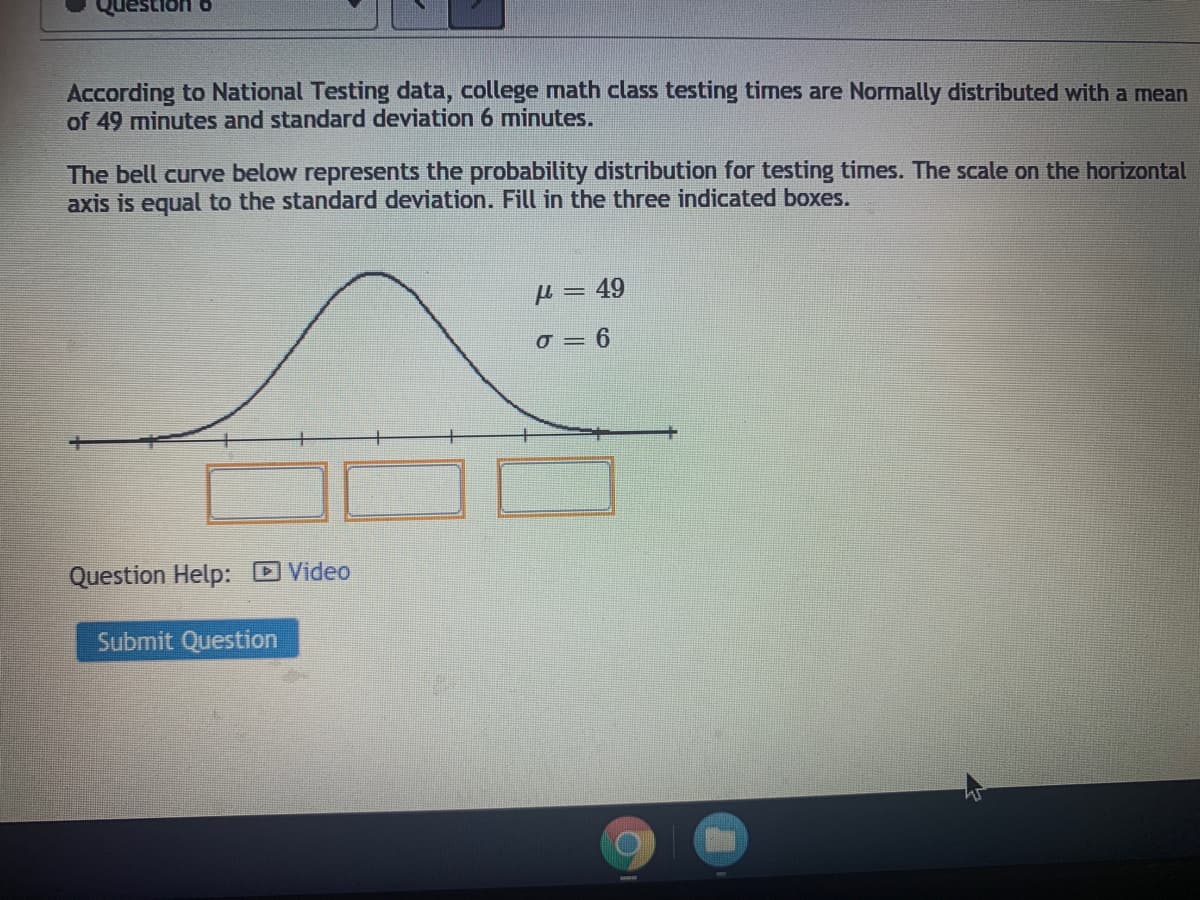
Transcribed Image Text:According to National Testing data, college math class testing times are Normally distributed with a mean
of 49 minutes and standard deviation 6 minutes.
The bell curve below represents the probability distribution for testing times. The scale on the horizontal
axis is equal to the standard deviation. Fill in the three indicated boxes.
µ = 49
o = 6
Question Help: DVideo
Submit Question
Expert Solution
This question has been solved!
Explore an expertly crafted, step-by-step solution for a thorough understanding of key concepts.

This is a popular solution!

Trending now
This is a popular solution!

Step by step
Solved in 3 steps with 3 images

Recommended textbooks for you
Glencoe Algebra 1, Student Edition, 9780079039897…
Algebra
ISBN:
9780079039897
Author:
Carter
Publisher:
McGraw Hill
Glencoe Algebra 1, Student Edition, 9780079039897…
Algebra
ISBN:
9780079039897
Author:
Carter
Publisher:
McGraw Hill