A random sample of n1 = 300 voters registered in the state of California showed that 143 voted in the last general election. A random sample of n2 = 216 registered voters in the state of Colorado showed that 130 voted in the most recent general election. Do these data indicate that the population proportion of voter turnout in Colorado is higher than that in California? Use a 5% level of significance.
A random sample of n1 = 300 voters registered in the state of California showed that 143 voted in the last general election. A random sample of n2 = 216 registered voters in the state of Colorado showed that 130 voted in the most recent general election. Do these data indicate that the population proportion of voter turnout in Colorado is higher than that in California? Use a 5% level of significance.

Glencoe Algebra 1, Student Edition, 9780079039897, 0079039898, 2018
18th Edition
ISBN:9780079039897
Author:Carter
Publisher:Carter
Chapter10: Statistics
Section10.6: Summarizing Categorical Data
Problem 30PPS

Related questions
Question
A random sample of n1 = 300 voters registered in the state of California showed that 143 voted in the last general election. A random sample of n2 = 216 registered voters in the state of Colorado showed that 130 voted in the most recent general election. Do these data indicate that the population proportion of voter turnout in Colorado is higher than that in California? Use a 5% level of significance.
I need help with sketching, d and e
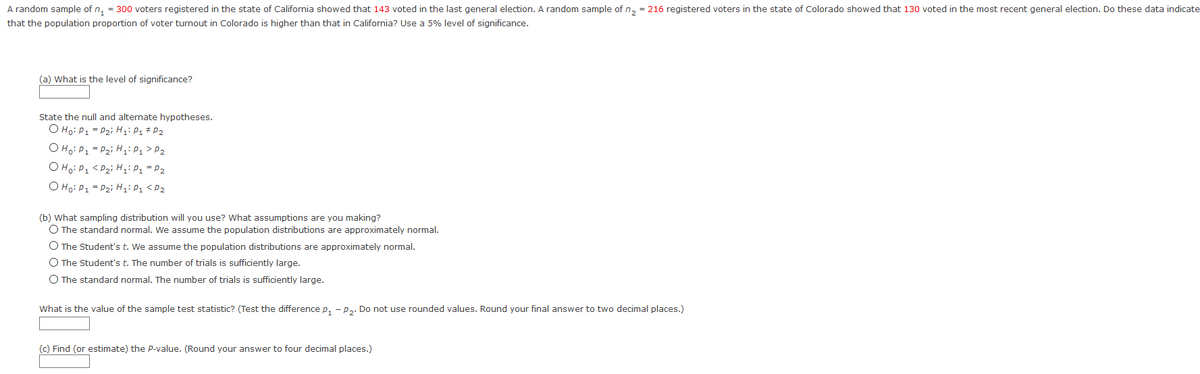
Transcribed Image Text:A random sample of n, = 300 voters registered in the state of California showed that 143 voted in the last general election. A random sample of n, = 216 registered voters in the state of Colorado showed that 130 voted in the most recent general election. Do these data indicate
that the population proportion of voter turnout in Colorado is higher than that in California? Use a 5% level of significance.
(a) What is the level of significance?
State the null and alternate hypotheses.
O Ho: P1 = P2i H;: P1 # P2
O Ho: P1 = P2i H;: P1 > P2
O Ho: P1 < Pzi H,iP1 = P2
O Ho: P1 = P2i H:P1 <P2
(b) What sampling distribution will you use? What assumptions are you making?
O The standard normal. We assume the population distributions are approximately normal.
O The Student's t. We assume the population distributions are approximately normal.
O The Student's t. The number of trials is sufficiently large.
O The standard normal. The number of trials is sufficiently large.
What is the value of the sample test statistic? (Test the difference p, - p.. Do not use rounded values. Round your final answer to two decimal places.)
(c) Find (or estimate) the P-value. (Round your answer to four decimal places.)
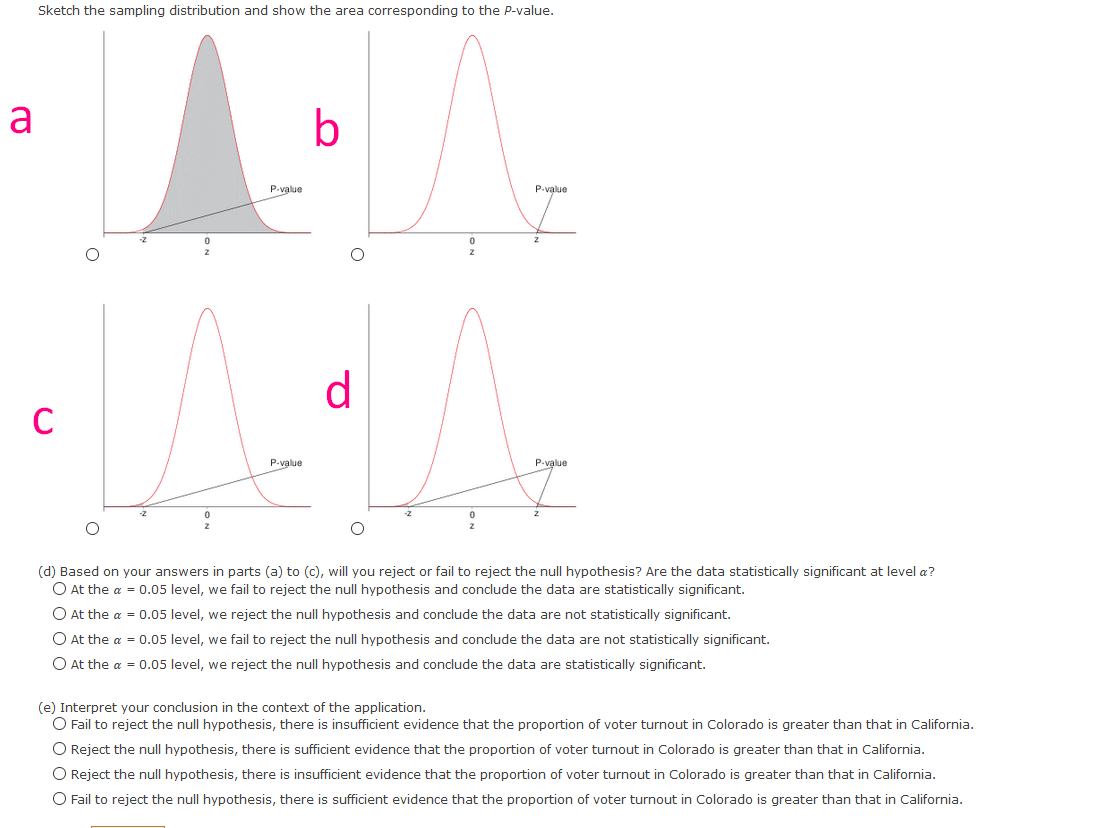
Transcribed Image Text:Sketch the sampling distribution and show the area corresponding to the P-value.
a
b
P-value
P-value
d
C
P-value
(d) Based on your answers in parts (a) to (c), will you reject or fail to reject the null hypothesis? Are the data statistically significant at level a?
O At the a = 0.05 level, we fail to reject the null hypothesis and conclude the data are statistically significant.
O At the a = 0.05 level, we reject the null hypothesis and conclude the data are not statistically significant.
O At the a = 0.05 level, we fail to reject the null hypothesis and conclude the data are not statistically significant.
O At the a = 0.05 level, we reject the null hypothesis and conclude the data are statistically significant.
(e) Interpret your conclusion in the context of the application.
O Fail to reject the null hypothesis, there is insufficient evidence that the proportion of voter turnout in Colorado is greater than that in California.
O Reject the null hypothesis, there is sufficient evidence that the proportion of voter turnout in Colorado is greater than that in California.
O Reject the null hypothesis, there is insufficient evidence that the proportion of voter turnout in Colorado is greater than that in California.
O Fail to reject the null hypothesis, there is sufficient evidence that the proportion of voter turnout in Colorado is greater than that in California.
Expert Solution
This question has been solved!
Explore an expertly crafted, step-by-step solution for a thorough understanding of key concepts.

Step by step
Solved in 4 steps with 1 images

Knowledge Booster


Learn more about
Need a deep-dive on the concept behind this application? Look no further. Learn more about this topic, statistics and related others by exploring similar questions and additional content below.Recommended textbooks for you
Glencoe Algebra 1, Student Edition, 9780079039897…
Algebra
ISBN:
9780079039897
Author:
Carter
Publisher:
McGraw Hill

College Algebra (MindTap Course List)
Algebra
ISBN:
9781305652231
Author:
R. David Gustafson, Jeff Hughes
Publisher:
Cengage Learning

Glencoe Algebra 1, Student Edition, 9780079039897…
Algebra
ISBN:
9780079039897
Author:
Carter
Publisher:
McGraw Hill
College Algebra (MindTap Course List)
Algebra
ISBN:
9781305652231
Author:
R. David Gustafson, Jeff Hughes
Publisher:
Cengage Learning