A random sample of the number of educational projects in each of the regions of the country are as follows 47 95 54 33 64 4 8 579 80 8 90 3 49 4 44 Estimate the mean number of educational projects for the regions in Ghana with 90% confidence.
A random sample of the number of educational projects in each of the regions of the country are as follows 47 95 54 33 64 4 8 579 80 8 90 3 49 4 44 Estimate the mean number of educational projects for the regions in Ghana with 90% confidence.

Glencoe Algebra 1, Student Edition, 9780079039897, 0079039898, 2018
18th Edition
ISBN:9780079039897
Author:Carter
Publisher:Carter
Chapter10: Statistics
Section10.5: Comparing Sets Of Data
Problem 1GP

Related questions
Question
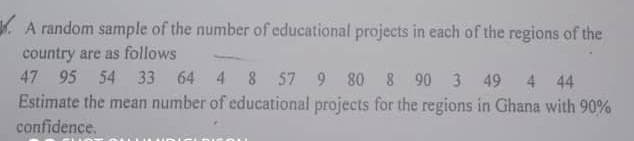
Transcribed Image Text:A random sample of the number of educational projects in each of the regions of the
country are as follows
47 95 54 33 64 4 8 57 9 80 8 90 3 49
4 44
Estimate the mean number of educational projects for the regions in Ghana with 90%
confidence.
Expert Solution
This question has been solved!
Explore an expertly crafted, step-by-step solution for a thorough understanding of key concepts.

Step by step
Solved in 2 steps

Recommended textbooks for you
Glencoe Algebra 1, Student Edition, 9780079039897…
Algebra
ISBN:
9780079039897
Author:
Carter
Publisher:
McGraw Hill
Glencoe Algebra 1, Student Edition, 9780079039897…
Algebra
ISBN:
9780079039897
Author:
Carter
Publisher:
McGraw Hill