Researchers wondered if there was a difference between males and females in regard to some common annoyances. They asked a random sample of males and females, the following question: "Are you annoyed by people who repeatedly check their mobile phones while having an in-person conversation?" Among the 524 males surveyed, 204 responded "Yes"; among the 511 females surveyed, 215 responded "Yes." Does the evidence suggest a higher proportion of females are annoyed by this behavior? Complete parts (a) through (g) below. (a) Determine the sample proportion for each sample. The proportions of the females and males who took the survey who are annoyed by the behavior in question are 0.4207 and 0.3893, respectively. (Round to four decimal places as needed.) (b) Explain why this study can be analyzed using the methods for conducting a hypothesis test regarding two independent proportions. Select all that apply. A. The sample size is less than 5% of the population size for each sample. B. n₁P₁ (1-₁) 210 and n₂P2 (1-P₂) ≥10 C. The samples are dependent. D. The samples are independent. E. The data come from a population that is normally distributed. F. The sample size is more than 5% of the population size for each sample. (c) What are the null and alternative hypotheses? Let p, represent the population proportion females who are annoyed by the behavior in question and p₂ represent the population proportion of males who are annoyed by the behavior in question. Ho: P₁ P₂ H₁: P₁ P₂ (d) Describe the sampling distribution of Pfemale - Pmale-Draw a normal model with the area representing the P-value shaded for this hypothesis test. The sampling distribution is approximately normal with mean and standard deviation. (Type an integer or decimal rounded to four decimal places as needed.)
Researchers wondered if there was a difference between males and females in regard to some common annoyances. They asked a random sample of males and females, the following question: "Are you annoyed by people who repeatedly check their mobile phones while having an in-person conversation?" Among the 524 males surveyed, 204 responded "Yes"; among the 511 females surveyed, 215 responded "Yes." Does the evidence suggest a higher proportion of females are annoyed by this behavior? Complete parts (a) through (g) below. (a) Determine the sample proportion for each sample. The proportions of the females and males who took the survey who are annoyed by the behavior in question are 0.4207 and 0.3893, respectively. (Round to four decimal places as needed.) (b) Explain why this study can be analyzed using the methods for conducting a hypothesis test regarding two independent proportions. Select all that apply. A. The sample size is less than 5% of the population size for each sample. B. n₁P₁ (1-₁) 210 and n₂P2 (1-P₂) ≥10 C. The samples are dependent. D. The samples are independent. E. The data come from a population that is normally distributed. F. The sample size is more than 5% of the population size for each sample. (c) What are the null and alternative hypotheses? Let p, represent the population proportion females who are annoyed by the behavior in question and p₂ represent the population proportion of males who are annoyed by the behavior in question. Ho: P₁ P₂ H₁: P₁ P₂ (d) Describe the sampling distribution of Pfemale - Pmale-Draw a normal model with the area representing the P-value shaded for this hypothesis test. The sampling distribution is approximately normal with mean and standard deviation. (Type an integer or decimal rounded to four decimal places as needed.)

Holt Mcdougal Larson Pre-algebra: Student Edition 2012
1st Edition
ISBN:9780547587776
Author:HOLT MCDOUGAL
Publisher:HOLT MCDOUGAL
Chapter11: Data Analysis And Probability
Section: Chapter Questions
Problem 8CR

Related questions
Question
Having some trouble on part D with sample distribution mean and deviation, thank you.
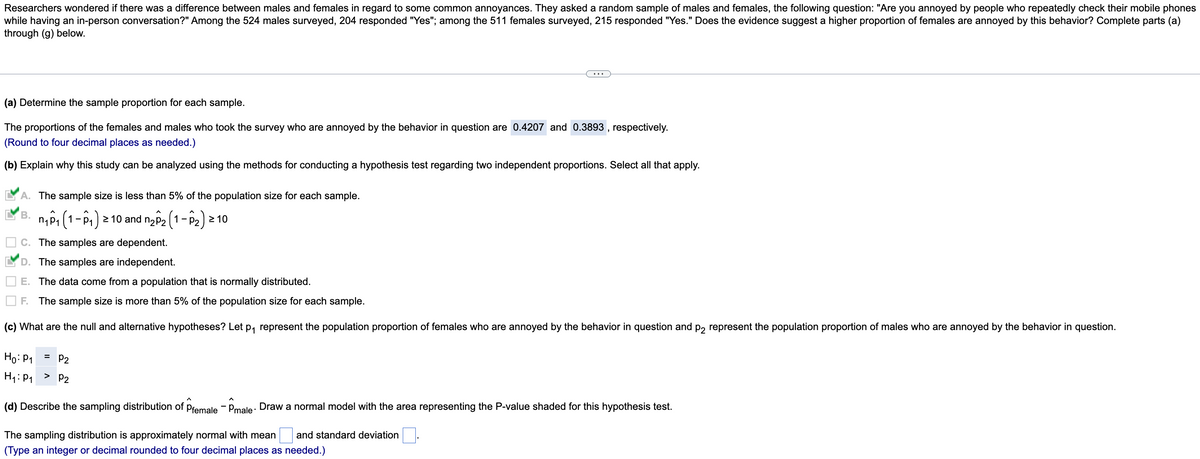
Transcribed Image Text:Researchers wondered if there was a difference between males and females in regard to some common annoyances. They asked a random sample of males and females, the following question: "Are you annoyed by people who repeatedly check their mobile phones
while having an in-person conversation?" Among the 524 males surveyed, 204 responded "Yes"; among the 511 females surveyed, 215 responded "Yes." Does the evidence suggest a higher proportion of females are annoyed by this behavior? Complete parts (a)
through (g) below.
(a) Determine the sample proportion for each sample.
The proportions of the females and males who took the survey who are annoyed by the behavior in question are 0.4207 and 0.3893, respectively.
(Round to four decimal places as needed.)
(b) Explain why this study can be analyzed using the methods for conducting a hypothesis test regarding two independent proportions. Select all that apply.
A. The sample size is less than 5% of the population size for each sample.
B. m₁p₁ (1-0₁) ² ≥ 10 and n₂p₂ (1-P₂
2P2
-P₂)
≥10
C. The samples are dependent.
D. The samples are independent.
E. The data come from a population that is normally distributed.
F. The sample size is more than 5% of the population size for each sample.
(c) What are the null and alternative hypotheses? Let p₁ represent the population proportion of females who are annoyed by the behavior in question and p2 represent the population proportion of males who are annoyed by the behavior in question.
Ho: P₁
= P2
H₁: P₁
P2
(d) Describe the sampling distribution of Pfemale Pmale. Draw a normal model with the area representing the P-value shaded for this hypothesis test.
The sampling distribution is approximately normal with mean and standard deviation
(Type an integer or decimal rounded to four decimal places as needed.)
Expert Solution
This question has been solved!
Explore an expertly crafted, step-by-step solution for a thorough understanding of key concepts.

This is a popular solution!

Trending now
This is a popular solution!

Step by step
Solved in 4 steps with 4 images

Recommended textbooks for you
Holt Mcdougal Larson Pre-algebra: Student Edition…
Algebra
ISBN:
9780547587776
Author:
HOLT MCDOUGAL
Publisher:
HOLT MCDOUGAL

Glencoe Algebra 1, Student Edition, 9780079039897…
Algebra
ISBN:
9780079039897
Author:
Carter
Publisher:
McGraw Hill

College Algebra (MindTap Course List)
Algebra
ISBN:
9781305652231
Author:
R. David Gustafson, Jeff Hughes
Publisher:
Cengage Learning
Holt Mcdougal Larson Pre-algebra: Student Edition…
Algebra
ISBN:
9780547587776
Author:
HOLT MCDOUGAL
Publisher:
HOLT MCDOUGAL
Glencoe Algebra 1, Student Edition, 9780079039897…
Algebra
ISBN:
9780079039897
Author:
Carter
Publisher:
McGraw Hill
College Algebra (MindTap Course List)
Algebra
ISBN:
9781305652231
Author:
R. David Gustafson, Jeff Hughes
Publisher:
Cengage Learning