A real estate agent believes that the mean home price in the northern part of a county is higher than price in the southern part of the county and would like to test the claim. A simple random sample of prices is taken from each region. The results are shown below. Southern Northern Mean 154.889 167.833 Variance 354.458 521.912 Observations Pooled Variance Hypothesized Mean Difference 18 18 438.185 df 34 p= Ex: 1.234 t Stat P(T<=t) one-tail t Critical one-tail P(T<=t) two-tail t Critical two-tail 1.885 0.036 1.691 0.072 2.032 -3 -2 2 3 Confidence Level 95% t = Ex: 1.234 n = Ex: 9 Degrees of freedom: df Point estimate for the southern part of the county: 1 Ex: 1.234 Point estimate for the northern part of the county: 2
A real estate agent believes that the mean home price in the northern part of a county is higher than price in the southern part of the county and would like to test the claim. A simple random sample of prices is taken from each region. The results are shown below. Southern Northern Mean 154.889 167.833 Variance 354.458 521.912 Observations Pooled Variance Hypothesized Mean Difference 18 18 438.185 df 34 p= Ex: 1.234 t Stat P(T<=t) one-tail t Critical one-tail P(T<=t) two-tail t Critical two-tail 1.885 0.036 1.691 0.072 2.032 -3 -2 2 3 Confidence Level 95% t = Ex: 1.234 n = Ex: 9 Degrees of freedom: df Point estimate for the southern part of the county: 1 Ex: 1.234 Point estimate for the northern part of the county: 2

College Algebra (MindTap Course List)
12th Edition
ISBN:9781305652231
Author:R. David Gustafson, Jeff Hughes
Publisher:R. David Gustafson, Jeff Hughes
Chapter8: Sequences, Series, And Probability
Section8.7: Probability
Problem 58E: What is meant by the sample space of an experiment?

Related questions
Question
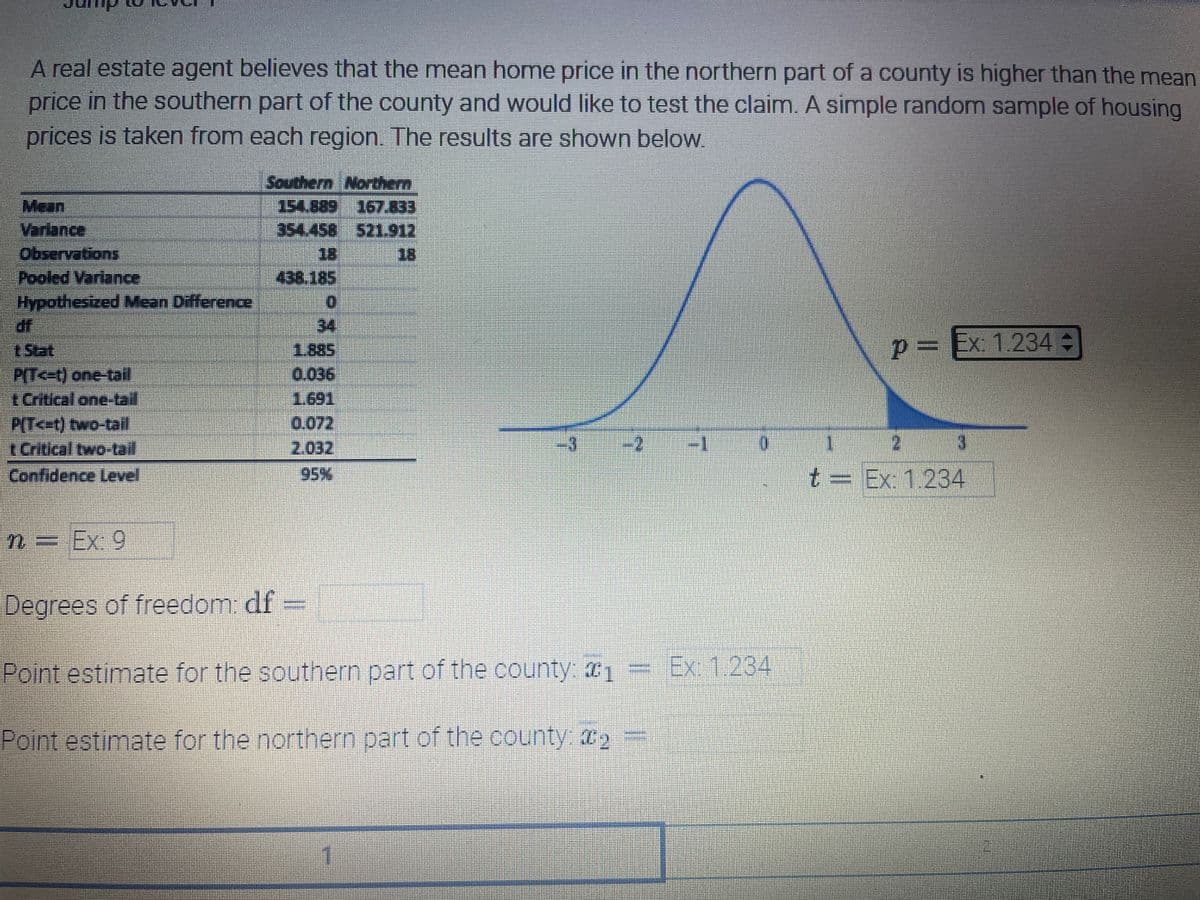
Transcribed Image Text:A real estate agent believes that the mean home price in the northern part of a county is higher than the mean
price in the southern part of the county and would like to test the claim. A simple random sample of housing
prices is taken from each region. The results are shown below.
Southern Northern
Variance
354.458 521912
18
Observations
18
Pooled Variance
Hypothesized Mean Difference
df
t Stat
438.185
34
1885
0.036
1.691
0.072
2.032
p= Ex: 1.234
P(T<=t) one-tail
t Critical one-tail
P(T<t) two-tail
tCritical two-talil
1.
Confidence Level
95%
t = Ex: 1.234
n= Ex 9
Degrees of freedom df -
Point estimate for the southern part of the county: 1
Ex 1.234
Point estimate for the northern part of the county: 2
1
Expert Solution
Step 1
We have to find values of blanks from given output.

Trending now
This is a popular solution!

Step by step
Solved in 2 steps with 1 images

Recommended textbooks for you
College Algebra (MindTap Course List)
Algebra
ISBN:
9781305652231
Author:
R. David Gustafson, Jeff Hughes
Publisher:
Cengage Learning
College Algebra (MindTap Course List)
Algebra
ISBN:
9781305652231
Author:
R. David Gustafson, Jeff Hughes
Publisher:
Cengage Learning