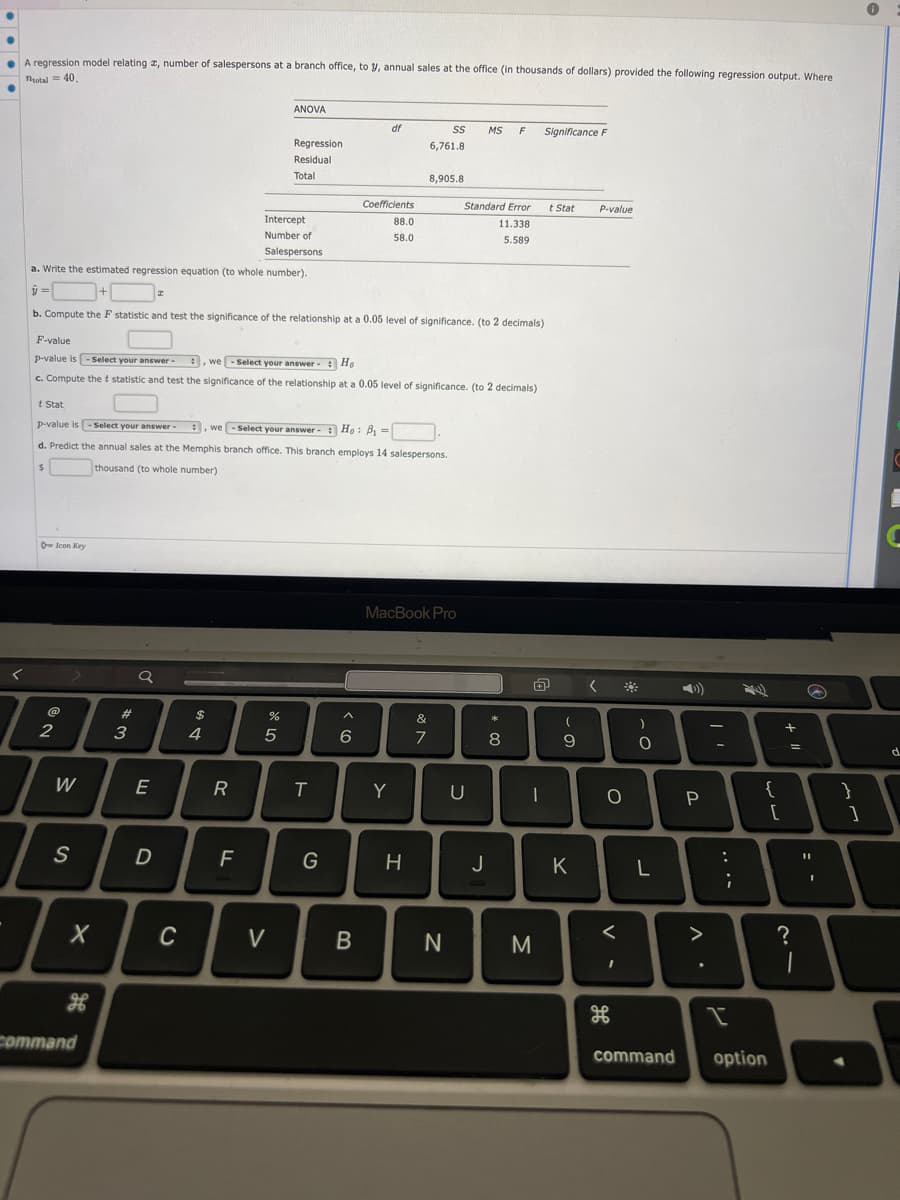
A regression model relating z, number of salespersons at a branch office, to y, annual sales at the office (in thousands of dollars) provided the following regression output. Where Total = 40. ANOVA Regression Residual Total Intercept Number of Salespersons a. Write the estimated regression equation (to whole number). df Coefficients 88.0 58.0 SS 6,761.8 8,905.8 MS F t Stat p-value is -Select your answer- we-Select your answer-Ho: B₁- d. Predict the annual sales at the Memphis branch office. This branch employs 14 salespersons. $ thousand (to whole number) Standard Error 11.338 5.589 Significance F b. Compute the F statistic and test the significance of the relationship at a 0.05 level of significance. (to 2 decimals) F-value p-value is -Select your answer- we-Select your answer- He c. Compute the t statistic and test the significance of the relationship at a 0.05 level of significance. (to 2 decimals) t Stat P-value
A regression model relating z, number of salespersons at a branch office, to y, annual sales at the office (in thousands of dollars) provided the following regression output. Where Total = 40. ANOVA Regression Residual Total Intercept Number of Salespersons a. Write the estimated regression equation (to whole number). df Coefficients 88.0 58.0 SS 6,761.8 8,905.8 MS F t Stat p-value is -Select your answer- we-Select your answer-Ho: B₁- d. Predict the annual sales at the Memphis branch office. This branch employs 14 salespersons. $ thousand (to whole number) Standard Error 11.338 5.589 Significance F b. Compute the F statistic and test the significance of the relationship at a 0.05 level of significance. (to 2 decimals) F-value p-value is -Select your answer- we-Select your answer- He c. Compute the t statistic and test the significance of the relationship at a 0.05 level of significance. (to 2 decimals) t Stat P-value

College Algebra
7th Edition
ISBN:9781305115545
Author:James Stewart, Lothar Redlin, Saleem Watson
Publisher:James Stewart, Lothar Redlin, Saleem Watson
Chapter1: Equations And Graphs
Section: Chapter Questions
Problem 10T: Olympic Pole Vault The graph in Figure 7 indicates that in recent years the winning Olympic men’s...

Related questions
Question
Statistic question.
Transcribed Image Text:A regression model relating 2, number of salespersons at a branch office, to y, annual sales at the office (in thousands of dollars) provided the following regression output. Where
Total = 40,
O Icon Key
2
W
S
X
M
H
Intercept
Number of
Salespersons
a. Write the estimated regression equation (to whole number).
y =
+
b. Compute the F statistic and test the significance of the relationship at a 0.05 level of significance. (to 2 decimals)
t Stat
p-value is-Select your answer - :, we-Select your answer: Ho: B₁ =
d. Predict the annual sales at the Memphis branch office. This branch employs 14 salespersons.
$
thousand (to whole number)
command
F-value
p-value is-Select your answer- -
, we-Select your answer: Ho
c. Compute the t statistic and test the significance of the relationship at a 0.05 level of significance. (to 2 decimals)
#
#m
3
I
E
D
C
$
4
R
F
ANOVA
%
Regression
Residual
Total
5
V
T
G
A
df
Coefficients
88.0
58.0
6
B
SS
6,761.8
Y
8,905.8
MacBook Pro
H
&
7
MS F
Standard Error
11.338
5.589
U
* 00
8
L
J
N
-
Significance F
M
t Stat
(
9
K
P-value
<
O
)
H
-O
L
<
3
P
. V
>
:
;
24
ww
I
command option
+ 11
=
11
?
1
M
}
1
0
d
Expert Solution
This question has been solved!
Explore an expertly crafted, step-by-step solution for a thorough understanding of key concepts.

This is a popular solution!

Trending now
This is a popular solution!

Step by step
Solved in 2 steps with 2 images

Recommended textbooks for you
College Algebra
Algebra
ISBN:
9781305115545
Author:
James Stewart, Lothar Redlin, Saleem Watson
Publisher:
Cengage Learning

College Algebra
Algebra
ISBN:
9781305115545
Author:
James Stewart, Lothar Redlin, Saleem Watson
Publisher:
Cengage Learning