
MATLAB: An Introduction with Applications
6th Edition
ISBN: 9781119256830
Author: Amos Gilat
Publisher: John Wiley & Sons Inc
expand_more
expand_more
format_list_bulleted
Related questions
Question
create graph of the two-variable data with a regression line, r, r2, and separate residual plot
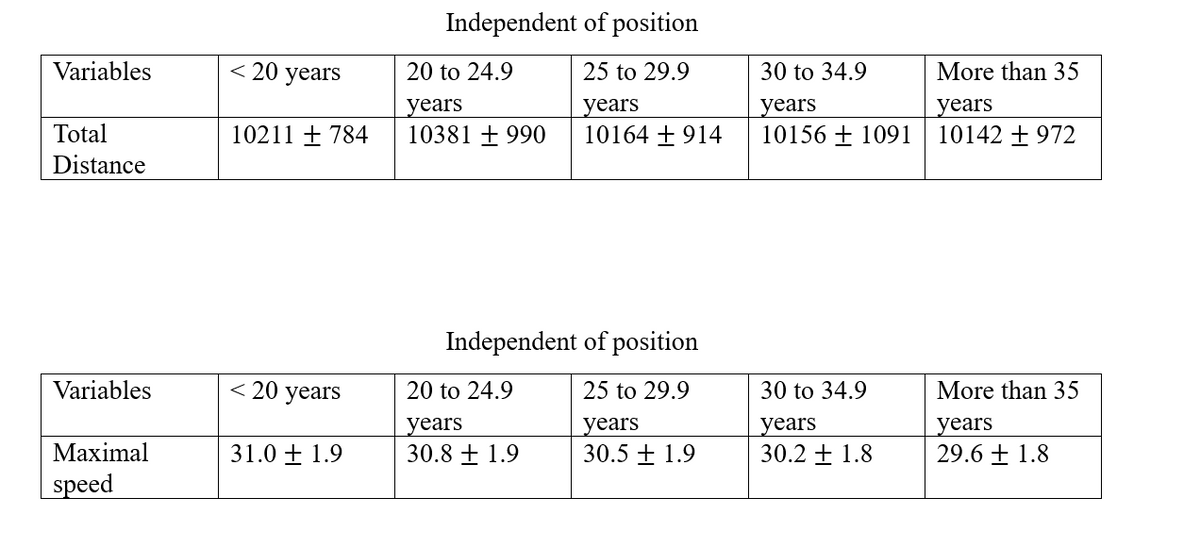

Transcribed Image Text:Variables
Total
Distance
Variables
Maximal
speed
< 20 years
10211 + 784
< 20 years
31.0 ± 1.9
Independent of position
25 to 29.9
years
10164 + 914
20 to 24.9
years
10381 +990
Independent of position
25 to 29.9
years
30.5 +1.9
20 to 24.9
years
30.8 ± 1.9
30 to 34.9
years
10156 + 1091
30 to 34.9
years
30.2 ± 1.8
More than 35
years
10142 +972
More than 35
years
29.6 ± 1.8
Expert Solution
This question has been solved!
Explore an expertly crafted, step-by-step solution for a thorough understanding of key concepts.

Step by stepSolved in 3 steps with 4 images

Knowledge Booster

Similar questions
- Analysis of the relationship between the fuel economy (combinedMPG) and displacement (in liters) for 1262 models of cars produces the regression model combinedMPH = 33.472 - 3.317Displacement. Explain what the slope means.arrow_forwardWhat does it mean for a regression line to be the "best-fit" line.arrow_forwardCompute the least-squares regression line for predicting the price of milk from the price of eggs. Round the slope and -intercept to at least four decimal places.arrow_forward
- A negative correlation between variables X and Y will always result in a positive slope in the linear regression model. Cannot tell from the given information. False Truearrow_forwardThe table below shows the amounts of crude oil (in thousands of barrels per day) produced by a country and the amounts of crude oil (in thousands of barrels per day) mported by a country, for the last seven years. Construct and interpret a 95% prediction interval for the amount of crude oil imported by the this country when the amount of crude oil produced by the country is 5,508 thousand barrels per day. The equation of the regression line is y = - 1.120x + 15,839.271. Oil produced, x 5,684 5,654 5,452 5,157 5,061 5,030 5,826 9,680 10,041 10,154 10,121 10,060 Oil imported, y 9,304 9,105 Construct and interpret a 95% prediction interval for the amount of crude oil imported when the amount of crude oil produced by the country is 5,508 thousand barrels per day. Select the correct choice below and fill in the answer boxes to complete your choice. (Round to the nearest cent as needed.) and O A. We can be 95% confident that when the amount of oil produced is 5,508 thousand barrels, the…arrow_forwardThe following table gives the data for the grades on the midterm exam and the grades on the final exam. Determine the equation of the regression line, yˆ=b0+b1x�^=�0+�1�. Round the slope and y-intercept to the nearest thousandth. Grades on Midterm and Final Exams Grades on Midterm 7171 6262 7878 9494 8383 8181 8080 9494 8585 6262 Grades on Final 8888 7979 8888 9191 8080 7070 7171 9393 6565 7777arrow_forward
- The age and height (in cm) of 400 adult women from Bolivia were measured. A researcher wants to know if age has any effect on height. A linear regression is carried out in Minitab and the following output obtained. Coefficients Term Constant Age (a) Write down the regression model. (b) Interpret the regression coefficient for the fitted model. (c) Use the output from Minitab to explain if the age of a participant affects their height. Percent (d) The normal probability plot of the residuals from this regression model is given below. Do the assumptions of the regression model seem reasonable? Justify your answer. 99.9 8 28 22299229 88 Coef SE Coef 152.94 7.69 0.022 0.231 01 -100 T-Value P-Value VIF 19.90 0.000 0.10 0.924 1.00 -50 Normal Probability Plot (response is Height) 0 Residual 50 ***** 100 150arrow_forward3- Find the equation of the regression line and find the y_ value for the specified x value. Calories and Cholesterol Calories and cholesterol are as follows: Calories X 390 535 720 300 430 500 440 Cholesterol y 43 45 80 50 55 52 60 Find y-hat when x = 600 calories. LO LOarrow_forwardexplain Regression analysis and its limationsarrow_forward
- The following table gives the data for the grades on the midterm exam and the grades on the final exam. Determine the equation of the regression line, yˆ=b0+b1xy^=b0+b1x. Round the slope and y-intercept to the nearest thousandth. Grades on Midterm and Final Exams Grades on Midterm 78 63 85 92 82 89 69 89 83 61 Grades on Final 77 75 88 92 86 86 80 85 77 63arrow_forwardThe table below shows the amounts of crude oil (in thousands of barrels per day) produced by a country and the amounts of crude oil (in thousands of barrels per day) imported by a country, for the last 7 years. Construct and interpret a 98% prediction interval for the amount of oil imported by the country and the amount of oil produced by the country is 5,483 thousand barrels per day. The equation of the regression line is y = -1.194x + 16,234.906arrow_forwardWhat are the assumptions of multiple linear regressions only?arrow_forward
arrow_back_ios
SEE MORE QUESTIONS
arrow_forward_ios
Recommended textbooks for you
- MATLAB: An Introduction with ApplicationsStatisticsISBN:9781119256830Author:Amos GilatPublisher:John Wiley & Sons Inc
 Probability and Statistics for Engineering and th...StatisticsISBN:9781305251809Author:Jay L. DevorePublisher:Cengage Learning
 Statistics for The Behavioral Sciences (MindTap C...StatisticsISBN:9781305504912Author:Frederick J Gravetter, Larry B. WallnauPublisher:Cengage Learning
  Elementary Statistics: Picturing the World (7th E...StatisticsISBN:9780134683416Author:Ron Larson, Betsy FarberPublisher:PEARSON
 The Basic Practice of StatisticsStatisticsISBN:9781319042578Author:David S. Moore, William I. Notz, Michael A. FlignerPublisher:W. H. Freeman
 Introduction to the Practice of StatisticsStatisticsISBN:9781319013387Author:David S. Moore, George P. McCabe, Bruce A. CraigPublisher:W. H. Freeman
MATLAB: An Introduction with Applications
Statistics
ISBN:9781119256830
Author:Amos Gilat
Publisher:John Wiley & Sons Inc
Probability and Statistics for Engineering and th...
Statistics
ISBN:9781305251809
Author:Jay L. Devore
Publisher:Cengage Learning
Statistics for The Behavioral Sciences (MindTap C...
Statistics
ISBN:9781305504912
Author:Frederick J Gravetter, Larry B. Wallnau
Publisher:Cengage Learning
Elementary Statistics: Picturing the World (7th E...
Statistics
ISBN:9780134683416
Author:Ron Larson, Betsy Farber
Publisher:PEARSON
The Basic Practice of Statistics
Statistics
ISBN:9781319042578
Author:David S. Moore, William I. Notz, Michael A. Fligner
Publisher:W. H. Freeman
Introduction to the Practice of Statistics
Statistics
ISBN:9781319013387
Author:David S. Moore, George P. McCabe, Bruce A. Craig
Publisher:W. H. Freeman