A report included the following information on the heights (in.) for non-Hispanic white females. Sample Sample Std. Error Size Mean Mean 0.09 0.11 Age 20-39 60 and older (a) Calculate a confidence interval at confidence level approximately 95% for the difference between population mean height for the younger women and that for the older women. (Use 20-39-60 and older") 863 932 64.5 62.7 Interpret the interval. O We are 95% confident that the true average height of younger women is less than that of older women by an amount within the confidence interval. We are 95% confident that the true average height of younger women greater than that of older women by an amount within the confidence interval. O We are 95% confident that the true average height of younger women is greater than that of older women by an amount outside the confidence interval. O We cannot draw a conclusion from the given information. (b) Let , denote the population mean height for those aged 20-39 and ₂ denote the population mean height for those aged 60 and older. Interpret the hypotheses Ho: M₁ M₂ = 1 and H₂ : ₁ - ₂ > 1. O The null hypothesis states that the true mean height for older women is 1 inch higher than for younger women. The alternative hypothesis states that the true mean height for older women is more than 1 inch higher than for younger women. The null hypothesis states that the true mean height for younger women is 1 inch higher than for older women. The alternative hypothesis states that the true mean height for younger women is more than 1 inch higher than for older women. O The null hypothesis states that the true mean height for older women is more than 1 inch higher than for younger women. The alternative hypothesis states that the true mean height for older women is 1 inch higher than for younger women. O The null hypothesis states that the true mean height for younger women is more than 1 inch higher than for older women. The alternative hypothesis states that the true mean height for younger women is 1 inch higher than for older women. P-value= Carry out a test of these hypotheses at significance level 0.001. Calculate the test statistic and determine the P-value. (Round your test statistic to two decimal places and your P-value to four decimal places.)
A report included the following information on the heights (in.) for non-Hispanic white females. Sample Sample Std. Error Size Mean Mean 0.09 0.11 Age 20-39 60 and older (a) Calculate a confidence interval at confidence level approximately 95% for the difference between population mean height for the younger women and that for the older women. (Use 20-39-60 and older") 863 932 64.5 62.7 Interpret the interval. O We are 95% confident that the true average height of younger women is less than that of older women by an amount within the confidence interval. We are 95% confident that the true average height of younger women greater than that of older women by an amount within the confidence interval. O We are 95% confident that the true average height of younger women is greater than that of older women by an amount outside the confidence interval. O We cannot draw a conclusion from the given information. (b) Let , denote the population mean height for those aged 20-39 and ₂ denote the population mean height for those aged 60 and older. Interpret the hypotheses Ho: M₁ M₂ = 1 and H₂ : ₁ - ₂ > 1. O The null hypothesis states that the true mean height for older women is 1 inch higher than for younger women. The alternative hypothesis states that the true mean height for older women is more than 1 inch higher than for younger women. The null hypothesis states that the true mean height for younger women is 1 inch higher than for older women. The alternative hypothesis states that the true mean height for younger women is more than 1 inch higher than for older women. O The null hypothesis states that the true mean height for older women is more than 1 inch higher than for younger women. The alternative hypothesis states that the true mean height for older women is 1 inch higher than for younger women. O The null hypothesis states that the true mean height for younger women is more than 1 inch higher than for older women. The alternative hypothesis states that the true mean height for younger women is 1 inch higher than for older women. P-value= Carry out a test of these hypotheses at significance level 0.001. Calculate the test statistic and determine the P-value. (Round your test statistic to two decimal places and your P-value to four decimal places.)

MATLAB: An Introduction with Applications
6th Edition
ISBN:9781119256830
Author:Amos Gilat
Publisher:Amos Gilat
Chapter1: Starting With Matlab
Section: Chapter Questions
Problem 1P

Related questions
Question
Q15 Please answer the fill-ins.
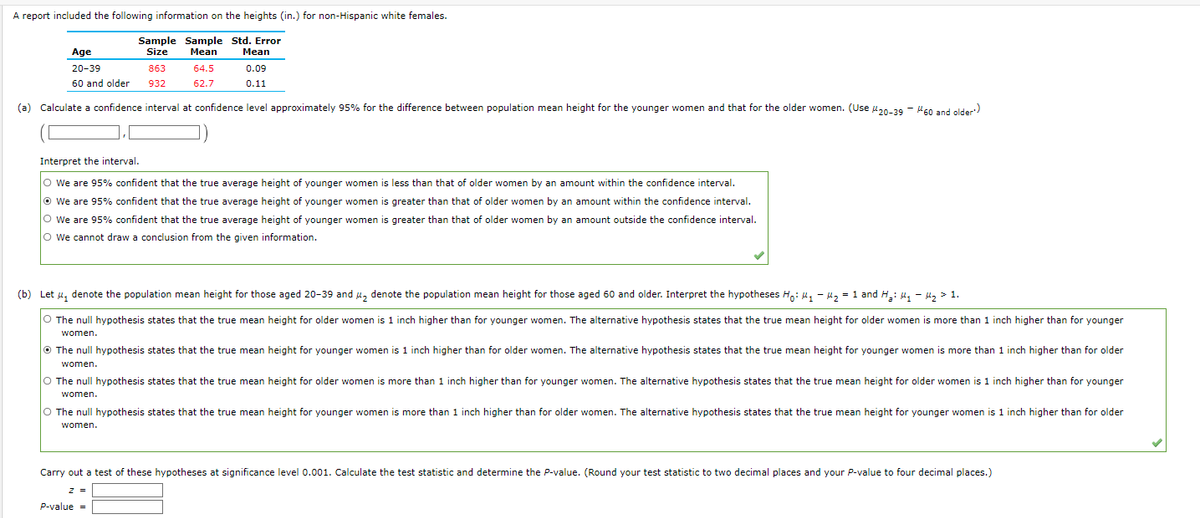
Transcribed Image Text:A report included the following information on the heights (in.) for non-Hispanic white females.
Sample Sample Std. Error
Size Mean Mean
0.09
0.11
Age
20-39
60 and older
863
932
(a) Calculate a confidence interval at confidence level approximately 95% for the difference between population mean height for the younger women and that for the older women. (Use 20-39-60 and older')
64.5
62.7
Interpret the interval.
O We are 95% confident that the true average height of younger women is less than that of older women by an amount within the confidence interval.
We are 95% confident that the true average height of younger women is greater than that of older women by an amount within the confidence interval.
O We are 95% confident that the true average height of younger women is greater than that of older women by an amount outside the confidence interval.
O We cannot draw a conclusion from the given information.
(b) Let, denote the population mean height for those aged 20-39 and ₂ denote the population mean height for those aged 60 and older. Interpret the hypotheses Ho: M₁ - ₂ = 1 and ₂: M₁ - ₂1.
O The null hypothesis states that the true mean height for older women is 1 inch higher than for younger women. The alternative hypothesis states that the true mean height for older women is more than 1 inch higher than for younger
women.
The null hypothesis states that the true mean height for younger women is 1 inch higher than for older women. The alternative hypothesis states that the true mean height for younger women is more than 1 inch higher than for older
women.
O The null hypothesis states that the true mean height for older women is more than 1 inch higher than for younger women. The alternative hypothesis states that the true mean height for older women is 1 inch higher than for younger
women.
O The null hypothesis states that the true mean height for younger women is more than 1 inch higher than for older women. The alternative hypothesis states that the true mean height for younger women is 1 inch higher than for older
women.
Carry out a test of these hypotheses at significance level 0.001. Calculate the test statistic and determine the P-value. (Round your test statistic to two decimal places and your P-value to four decimal places.)
z =
P-value =
Expert Solution
This question has been solved!
Explore an expertly crafted, step-by-step solution for a thorough understanding of key concepts.

This is a popular solution!

Trending now
This is a popular solution!

Step by step
Solved in 2 steps with 2 images

Recommended textbooks for you
MATLAB: An Introduction with Applications
Statistics
ISBN:
9781119256830
Author:
Amos Gilat
Publisher:
John Wiley & Sons Inc

Probability and Statistics for Engineering and th…
Statistics
ISBN:
9781305251809
Author:
Jay L. Devore
Publisher:
Cengage Learning

Statistics for The Behavioral Sciences (MindTap C…
Statistics
ISBN:
9781305504912
Author:
Frederick J Gravetter, Larry B. Wallnau
Publisher:
Cengage Learning
MATLAB: An Introduction with Applications
Statistics
ISBN:
9781119256830
Author:
Amos Gilat
Publisher:
John Wiley & Sons Inc
Probability and Statistics for Engineering and th…
Statistics
ISBN:
9781305251809
Author:
Jay L. Devore
Publisher:
Cengage Learning
Statistics for The Behavioral Sciences (MindTap C…
Statistics
ISBN:
9781305504912
Author:
Frederick J Gravetter, Larry B. Wallnau
Publisher:
Cengage Learning

Elementary Statistics: Picturing the World (7th E…
Statistics
ISBN:
9780134683416
Author:
Ron Larson, Betsy Farber
Publisher:
PEARSON

The Basic Practice of Statistics
Statistics
ISBN:
9781319042578
Author:
David S. Moore, William I. Notz, Michael A. Fligner
Publisher:
W. H. Freeman

Introduction to the Practice of Statistics
Statistics
ISBN:
9781319013387
Author:
David S. Moore, George P. McCabe, Bruce A. Craig
Publisher:
W. H. Freeman