A research center claims that 28% of adults in a certain country would travel into space on a commercial flight if they could afford it. In a random sample of 1100 adults in that country, 31% say that they would travel into space on a commercial flight if they could afford it. At a =0.10, is there enough evidence to reject the research center's claim? Complete parts (a) through (d) below. (a) Identify the claim and state Ho and Ha. Identify the claim in this scenario. Select the correct choice below and fill in the answer box to complete your choice. (Type an integer or a decimal. Do not round.) O A. The percentage adults in the country who would travel into space on a commercial flight if they could afford it is not %. OB. % of adults in the country would travel into space on a commercial flight if they could afford it. O C. At least % of adults in the country would travel into space on a commercial flight if they could afford it. O D. No more than % of adults in the country would travel into space on a commercial flight if they could afford it. Let p be the population proportion of successes, where a success is an adult in the country who would travel into space on a commercial fight if they could afford it. State Ho and H. Select the correct choice below and fill in the answer boxes to complete your choice. (Round to two decimal places as needed.) OC. Ho: p> H ps OF. Ho: p O A. Ho:P= O B. HoipZ O D. Ho: ps O E. Hoipe H:p= Ha: p> (b) Use technology to find the P-value. Identify the standardized test statistic. (Round to two decimal places as needed.) Identify the P-value. (Round to three decimal places as needed.) (c) Decide whether to reject or fail to reject the null hypothesis and (d) interpret the decision in the context of the original claim. V the research center's claim. enough evidence to V the null hypothesis. There
A research center claims that 28% of adults in a certain country would travel into space on a commercial flight if they could afford it. In a random sample of 1100 adults in that country, 31% say that they would travel into space on a commercial flight if they could afford it. At a =0.10, is there enough evidence to reject the research center's claim? Complete parts (a) through (d) below. (a) Identify the claim and state Ho and Ha. Identify the claim in this scenario. Select the correct choice below and fill in the answer box to complete your choice. (Type an integer or a decimal. Do not round.) O A. The percentage adults in the country who would travel into space on a commercial flight if they could afford it is not %. OB. % of adults in the country would travel into space on a commercial flight if they could afford it. O C. At least % of adults in the country would travel into space on a commercial flight if they could afford it. O D. No more than % of adults in the country would travel into space on a commercial flight if they could afford it. Let p be the population proportion of successes, where a success is an adult in the country who would travel into space on a commercial fight if they could afford it. State Ho and H. Select the correct choice below and fill in the answer boxes to complete your choice. (Round to two decimal places as needed.) OC. Ho: p> H ps OF. Ho: p O A. Ho:P= O B. HoipZ O D. Ho: ps O E. Hoipe H:p= Ha: p> (b) Use technology to find the P-value. Identify the standardized test statistic. (Round to two decimal places as needed.) Identify the P-value. (Round to three decimal places as needed.) (c) Decide whether to reject or fail to reject the null hypothesis and (d) interpret the decision in the context of the original claim. V the research center's claim. enough evidence to V the null hypothesis. There

Linear Algebra: A Modern Introduction
4th Edition
ISBN:9781285463247
Author:David Poole
Publisher:David Poole
Chapter4: Eigenvalues And Eigenvectors
Section4.6: Applications And The Perron-frobenius Theorem
Problem 25EQ

Related questions

Concept explainers
Contingency Table
A contingency table can be defined as the visual representation of the relationship between two or more categorical variables that can be evaluated and registered. It is a categorical version of the scatterplot, which is used to investigate the linear relationship between two variables. A contingency table is indeed a type of frequency distribution table that displays two variables at the same time.
Binomial Distribution
Binomial is an algebraic expression of the sum or the difference of two terms. Before knowing about binomial distribution, we must know about the binomial theorem.
Topic Video
Question
Solve all parts please
5
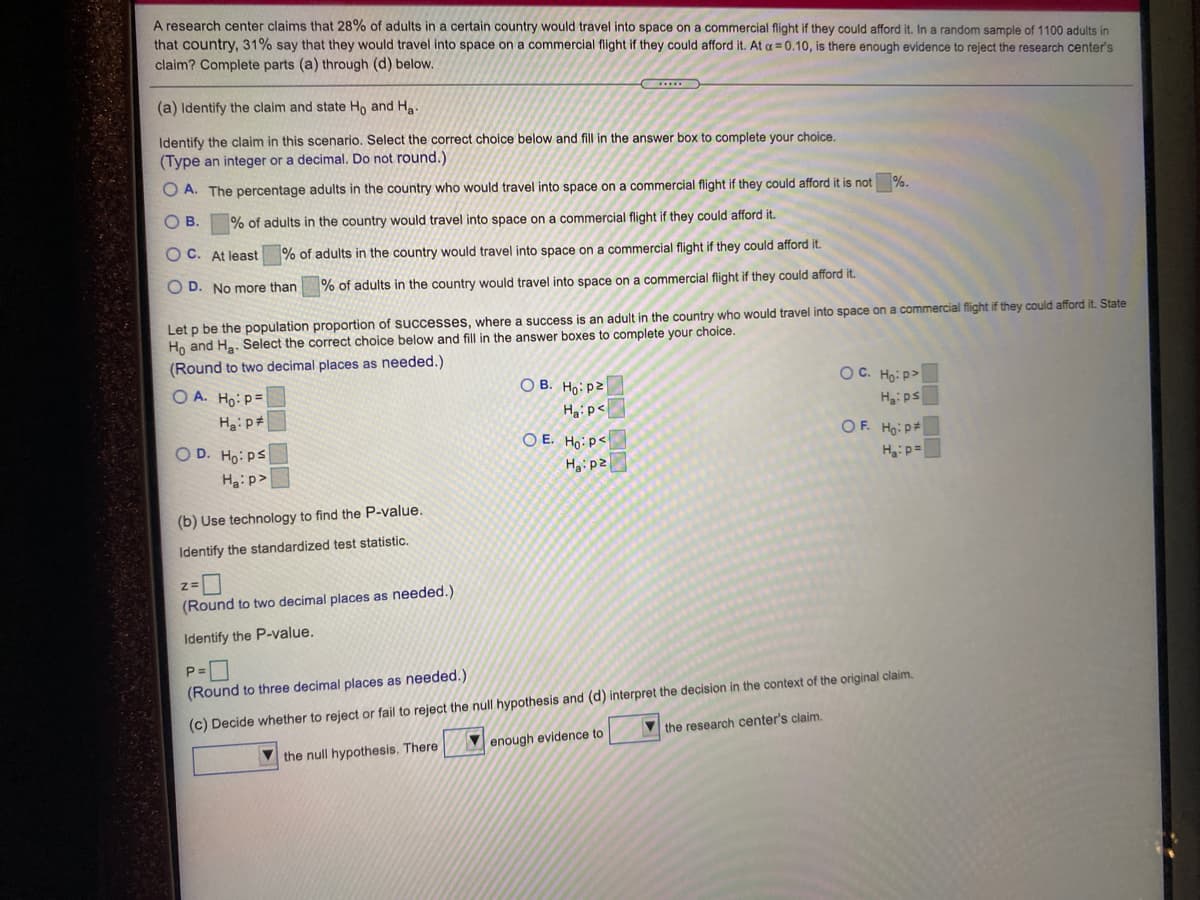
Transcribed Image Text:A research center claims that 28% of adults in a certain country would travel into space on a commercial flight if they could afford it. In a random sample of 1100 adults in
that country, 31% say that they would travel into space on a commercial flight if they could afford it. At a = 0.10, is there enough evidence to reject the research center's
claim? Complete parts (a) through (d) below.
(a) Identify the claim and state Ho and Ha.
Identify the claim in this scenario. Select the correct choice below and fill in the answer box to complete your choice.
(Type an integer or a decimal. Do not round.)
O A. The percentage adults in the country who would travel into space on a commercial flight if they could afford it is not
%.
O B.
% of adults in the country would travel into space on a commercial flight if they could afford it.
O C. At least
% of adults in the country would travel into space on a commercial flight if they could afford it.
O D. No more than
% of adults in the country would travel into space on a commercial flight if they could afford it.
Let p be the population proportion of successes, where a success is an adult in the country who would travel into space on a commercial flight if they could afford it. State
Ho and Ha. Select the correct choice below and fill in the answer boxes to complete your choice.
(Round to two decimal places as needed.)
O B. HoipZ
OC. Ho: P>
O A. Ho: P=
Hai p#
Ha:ps
Ha:p<
O E. Hoip<
Haip2
OF. Ho: p#
H:p=
O D. Ho: ps
Hai p>
(b) Use technology to find the P-value.
Identify the standardized test statistic.
z=
(Round to two decimal places as needed.)
Identify the P-value.
P=
(Round to three decimal places as needed.)
(c) Decide whether to reject or fail to reject the null hypothesis and (d) interpret the decision in the context of the original claim.
V the research center's claim.
Venough evidence to
V the null hypothesis. There
Expert Solution
This question has been solved!
Explore an expertly crafted, step-by-step solution for a thorough understanding of key concepts.

This is a popular solution!

Trending now
This is a popular solution!

Step by step
Solved in 4 steps with 4 images

Knowledge Booster


Learn more about
Need a deep-dive on the concept behind this application? Look no further. Learn more about this topic, probability and related others by exploring similar questions and additional content below.Recommended textbooks for you
Linear Algebra: A Modern Introduction
Algebra
ISBN:
9781285463247
Author:
David Poole
Publisher:
Cengage Learning
Linear Algebra: A Modern Introduction
Algebra
ISBN:
9781285463247
Author:
David Poole
Publisher:
Cengage Learning