The following table contains data from a physics experiment. Complete the table. Trial Rate (m/sec) Time (sec) Distance (m) k12 + 3k1 + 2 k1 – k,² – 3k1 k1 + 1 1 - 3 k22 + 6k2 + 5 k2 + 1 2 k22 + 11k2 + 30
The following table contains data from a physics experiment. Complete the table. Trial Rate (m/sec) Time (sec) Distance (m) k12 + 3k1 + 2 k1 – k,² – 3k1 k1 + 1 1 - 3 k22 + 6k2 + 5 k2 + 1 2 k22 + 11k2 + 30

Algebra & Trigonometry with Analytic Geometry
13th Edition
ISBN:9781133382119
Author:Swokowski
Publisher:Swokowski
Chapter2: Equations And Inequalities
Section2.7: More On Inequalities
Problem 44E

Related questions
Question
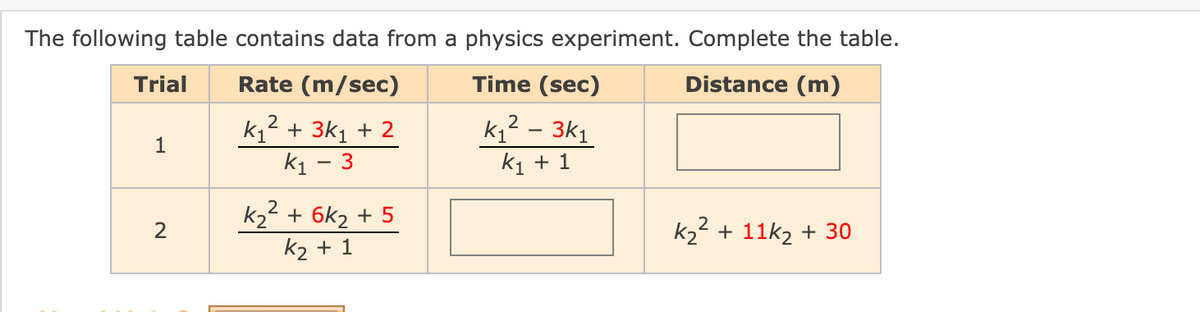
Transcribed Image Text:The following table contains data from a physics experiment. Complete the table.
Trial
Rate (m/sec)
Time (sec)
Distance (m)
kq² – 3k1
k1 + 1
k1² + 3k1 + 2
1
k1
3
2
k2 + 6k2 + 5
k2 + 1
2
k22 + 11k2 + 30
Expert Solution
This question has been solved!
Explore an expertly crafted, step-by-step solution for a thorough understanding of key concepts.

This is a popular solution!

Trending now
This is a popular solution!

Step by step
Solved in 2 steps with 2 images

Knowledge Booster


Learn more about
Need a deep-dive on the concept behind this application? Look no further. Learn more about this topic, algebra and related others by exploring similar questions and additional content below.Recommended textbooks for you
Algebra & Trigonometry with Analytic Geometry
Algebra
ISBN:
9781133382119
Author:
Swokowski
Publisher:
Cengage

Trigonometry (MindTap Course List)
Trigonometry
ISBN:
9781337278461
Author:
Ron Larson
Publisher:
Cengage Learning
Algebra & Trigonometry with Analytic Geometry
Algebra
ISBN:
9781133382119
Author:
Swokowski
Publisher:
Cengage
Trigonometry (MindTap Course List)
Trigonometry
ISBN:
9781337278461
Author:
Ron Larson
Publisher:
Cengage Learning