A researcher is examining the relationship between stress levels and performance on a test of cognitive performance. She hypothesizes that stress levels lead to an increase in performance to a point, and then increased stress decreases performance. She tests 10 participants who have the following levels of stress: 10.94 12.76 7.62 8.17 7.83 12.22 9.23 11.17 11.88 8.18 When she tests their levels of mental performance, she finds the following cognitive performance scores (listed in the same participant order as above): 5.24 4.64 4.68 5.04 4.17 6.20 4.54 6.55 5.79 3.17 Perform a linear regression to examine the relationship between these variables. What do the results mean?
A researcher is examining the relationship between stress levels and performance on a test of cognitive performance. She hypothesizes that stress levels lead to an increase in performance to a point, and then increased stress decreases performance. She tests 10 participants who have the following levels of stress: 10.94 12.76 7.62 8.17 7.83 12.22 9.23 11.17 11.88 8.18 When she tests their levels of mental performance, she finds the following cognitive performance scores (listed in the same participant order as above): 5.24 4.64 4.68 5.04 4.17 6.20 4.54 6.55 5.79 3.17 Perform a linear regression to examine the relationship between these variables. What do the results mean?

Biology: The Dynamic Science (MindTap Course List)
4th Edition
ISBN:9781305389892
Author:Peter J. Russell, Paul E. Hertz, Beverly McMillan
Publisher:Peter J. Russell, Paul E. Hertz, Beverly McMillan
Chapter21: Microevolution: Genetic Changes Within Populations
Section: Chapter Questions
Problem 8TYK: If the genotype frequencies in a population are 0.60 AA, 0.20 Aa, and 0.20 aa, and if the...

Related questions
Question
A researcher is examining the relationship between stress levels and performance on a test of cognitive performance. She hypothesizes that stress levels lead to an increase in performance to a point, and then increased stress decreases performance. She tests 10 participants who have the following levels of stress:
10.94
12.76
7.62
8.17
7.83
12.22
9.23
11.17
11.88
8.18
When she tests their levels of mental performance, she finds the following cognitive performance scores (listed in the same participant order as above):
5.24
4.64
4.68
5.04
4.17
6.20
4.54
6.55
5.79
3.17
Perform a linear regression to examine the relationship between these variables. What do the results mean?
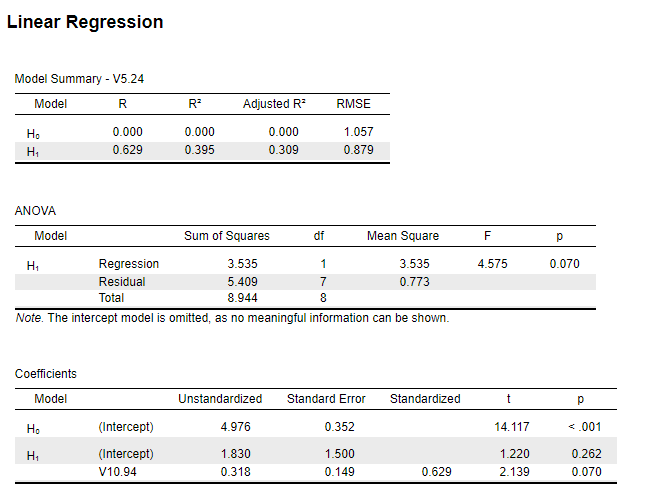
Transcribed Image Text:Linear Regression
Model Summary - V5.24
Model
R
R
Adjusted R
RMSE
Но
0.000
0.000
0.000
1.057
0.629
0.395
0.309
0.879
ANOVA
Model
Sum of Squares
df
Mean Square
p
Regression
3.535
1
3.535
4.575
0.070
Residual
5.409
7
0.773
Total
8.944
8
Note. The intercept model is omitted, as no meaningful information can be shown.
Coefficients
Model
Unstandardized
Standard Error
Standardized
t
Но
(Intercept)
4.976
0.352
14.117
<.001
H1
(Intercept)
1.830
1.500
1.220
0.262
V10.94
0.318
0.149
0.629
2.139
0.070
Expert Solution
This question has been solved!
Explore an expertly crafted, step-by-step solution for a thorough understanding of key concepts.

Step by step
Solved in 2 steps with 3 images

Recommended textbooks for you
Biology: The Dynamic Science (MindTap Course List)
Biology
ISBN:
9781305389892
Author:
Peter J. Russell, Paul E. Hertz, Beverly McMillan
Publisher:
Cengage Learning

Biology: The Dynamic Science (MindTap Course List)
Biology
ISBN:
9781305389892
Author:
Peter J. Russell, Paul E. Hertz, Beverly McMillan
Publisher:
Cengage Learning