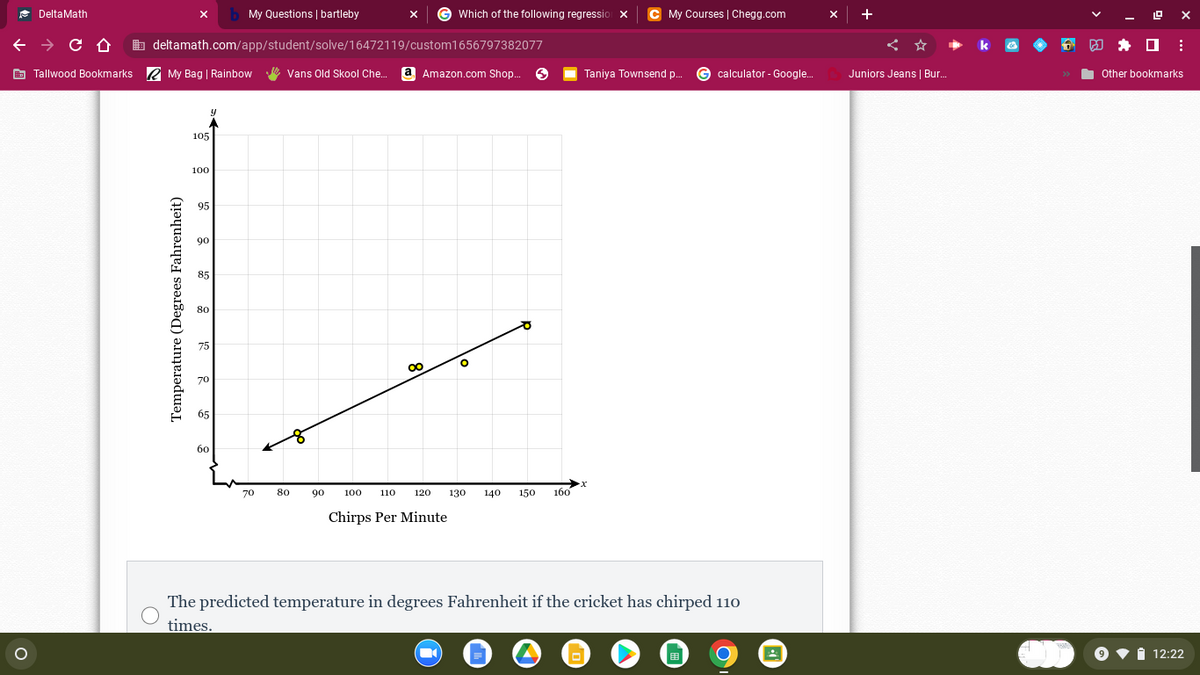
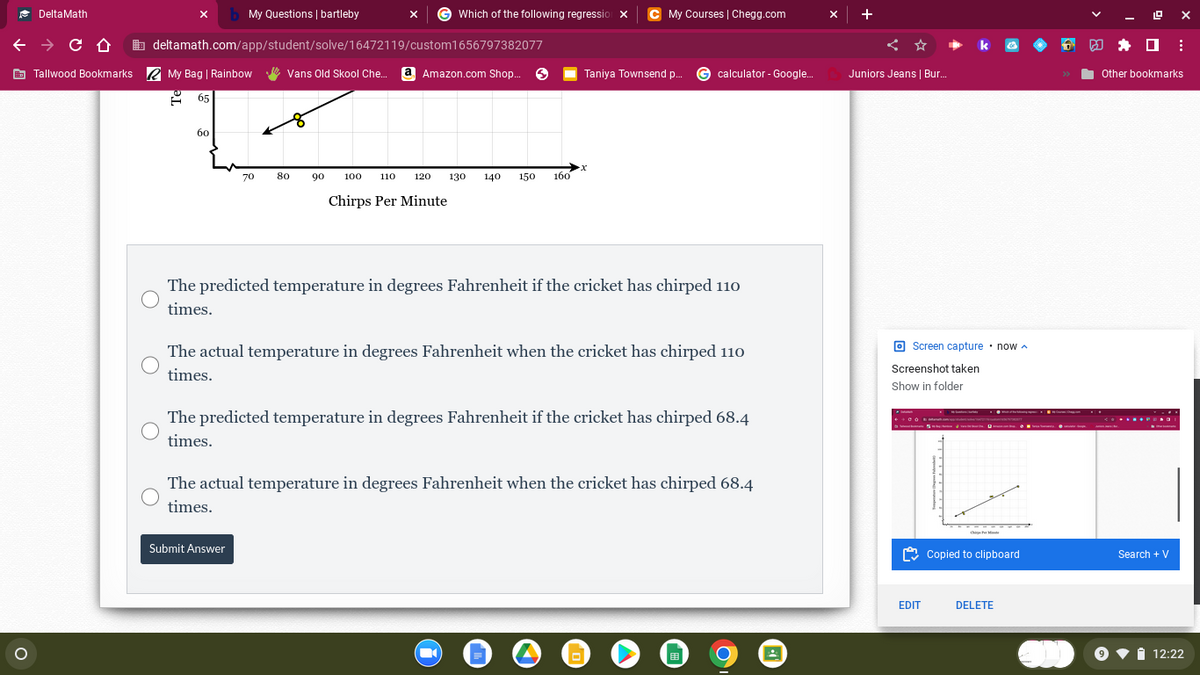
A researcher studied the relationship between the number of times a certain species of cricket will chirp in one minute and the temperature outside. Her data is expressed in the scatter plot and line of best fit below. What is the meaning of the yy-value on the line when x=110x=110?
Q: Furnace repair bills are normally distributed with a mean of µ = 273 dollars and a standard…
A: Hi there! Since there are two different questions, we will solve one question for you. To get the…
Q: You are conducting a study to see if the proportion of voters who prefer Candidate A is…
A: Given p=0.16, n=598, x= number of success=111 Ho:p=0.16H1:p>0.16( right tailed)
Q: Test the hypothesis using the P-value approach. Be sure to verify the requirements of the test.…
A: Given,n=200 , X=190H0:P=0.9 VS H1:P>0.9and α=0.05
Q: Test the independence of the two variables in the table below: Enter the test statistic (to 4…
A: Solution: The observed count table is Yes No Row Total Happy 40 80 120 Sad 120 200 320…
Q: Sum of a pair of die 2 3 4 5 6 7 8 9 No. of appearances 5 7 1 8 1 2 6 10 8 11 7 12 1 In a game of…
A:
Q: Determine the P-value.
A: It is given that Test statistic z = 1.80 Test : Right-tailed
Q: Suppose that in a large lecture class of 800 students, 520 students (65%) attend the lecture…
A: Given Information: In a large lecture class, 65% attend the lecture regularly i.e., p=0.65 Sample…
Q: A survey asked a random sample students if they estimated they spent more or less than an hour a day…
A: Given that More less 7th grade 24 25 8th grade 28 26 We have to find the number of…
Q: Construct a 99% confidence interval of the population proportion using the given information.…
A:
Q: Hi! I just need Part #4 and #5. The following table shows the systolic blood pressure of 5 women…
A: Given that The following table shows the systolic blood pressure of 5 women and 5 men. Women…
Q: The following table shows the systolic blood pressure of 5 women and 5 men. Women 110 120 95…
A: As per our guidelines we are supposed to answer only 3 sub-parts of any questions so i am solving…
Q: A light bulb manufacturer guarantees that the mean life of a certain type of light bulb is at least…
A:
Q: The accompanying data table contains the annual high values of a stock market price index for a…
A: Given information: 335, 350, 491, 500, 611, 729, 818, 821, 886, 1040, 1071, 1151, 1168, 1235, 1309,…
Q: The following data related the rubber percentage of two types of rubber plants, where the sample…
A: We state the hypothesis for testing the difference of means. H0: There is no difference between…
Q: Problem 45 Please Answer quickly.. In your pocket you have three dimes (coins of 10 cents) and two…
A:
Q: Find the mean, median, and mode of the following data. If necessary round to one more decimal place…
A:
Q: A researcher investigated four different word lists for use in hearing assessments. She wanted to…
A: Given that World list A World list B World list C World list D Sample size 24 24 24 24…
Q: A researcher wishes to examine the relationship between years of schooling completed and the number…
A: Given: Y = 3-5X Where, X = No. of years schooling completed. Y = No. of pregnancies.
Q: A therapist was interested in determining whether patients experiences reduced anxiety following…
A: Sample size N = 9 We have to use repeated samples t-test.
Q: A company claims that the mean monthly residential electricity consumption in a certain region is…
A: Given that Sample size n =69 Sample mean =900 Population standard deviation =121
Q: Based on the data shown below, calculate the correlation coefficient (rounded to three decimal…
A: Correlation coefficient is denoted by r
Q: Use the Student's tt-distribution to find the tt-value for each of the given scenarios. Round…
A: Hey there! Thank you for posting the question. Since your question has more than 3 parts, we are…
Q: A firm has economies of scale if, as the firm increases its output, Question 18 options: The…
A:
Q: Define the mean, median, and mode of the following data. If necessary round to one more decimal…
A: Given that 0.68 0.29 0.63 0.58 0.79 0.62 0.30 0.51 0.37 0.46 0.35 0.52 0.79 0.34 0.51 0.65 0.57…
Q: The following table shows the systolic blood pressure of 5 women and 5 men. Women 110 120 95…
A: We state the hypothesis for testing difference in means. H0: There is no significant difference…
Q: The age of children in kindergarten on the first day of school is uniformly distributed between 4.79…
A: From the provided information, Mean (µ) = 4.79 Standard deviation (σ) = 5.81 X~N (4.79, 5.81) Here X…
Q: A random sample of 85 eighth grade students' scores on a national mathematics assessment test has a…
A:
Q: How do you calculate Pearson's r?
A: Let X and Y are two variables then to calculate person's correlation coefficient, We sum all Xi's…
Q: TI-84 Plus CE NORMAL FLOAT AUTO REAL RADIAN MP CHNOTKON I 0.19 8.15 0.09 8.1 0.08 0.02 1 ---- -- 1
A: Hello thankyou for your patience and determination to solve the problem. You did not miss anything,…
Q: If the probability that a randomly chosen college student takes statistics is 0.16, then what is the…
A:
Q: Assume that a randomly selected subject is given a bone density test. Those test scores are normally…
A: From the provided information, Mean (µ) = 0 Standard deviation (σ) = 1 X~N (0, 1) Here X be a random…
Q: A CBS News poll conducted June 10 and 11, 2006, among a nationwide random sample of 651 adults,…
A: As per our guidelines I can solve only first 3 subparts. Post the remaining subparts again and…
Q: You determined there was a positive correlation between the number of study hours a week a student…
A: Given regression equation isy=2.079x+41If x=14y=?
Q: If the test statistic on a 2-sided test is 2.8880 with a p-value of 0.0447, what would be the…
A: We have given that Test statistic = 2.8880 p-value = 0.0447 Significance level (α) = 3% = 0.03
Q: Suppose that a researcher obtains a correlation of r equals 0.60 for a sample of n equals 10…
A:
Q: Do men take less time than women to get out of bed in the morning? The 60 men observed averaged 4.9…
A:
Q: The operations manager of a large production plant would like to estimate the average amount of time…
A: The standard deviation is 7 minutes; σ=7minutes Margin of error=22 seconds Confidence level is…
Q: Find the mean and standard deviation for each binomial random variable: a. n = 45, ππ = .65 (Round…
A: Given that X~binomial (n,π) Where n= number of trials π= success of probability.
Q: Find the critical value(s) and rejection region(s) for the indicated t-test, level of significance…
A: It is given that Sample size n = 13 Level of significance = 0.10 Test : two-tailed.
Q: Course grade and study time A graduate teaching assistant for an introductory statistics course…
A:
Q: Identifying the Method of Analysis Identify the method of analysis needed to answer the question.…
A: The researcher wants to determine whether there is a difference in the typical length of time…
Q: Which of the following statement is INCORRECT about the reason for running a two-samples t-test…
A: Answer is in step 2
Q: K Grade-point averages. Find the mean and median for the grouped data in the following table.…
A: Formula Used: Mean = ∑FXn Median = L+n2-CFF×h L = lower interval of median class n = sum of…
Q: How do I explain applying the normal curve to a set of test scores?
A:
Q: discuss discrete and continous distribution show example
A: Please find the explanation below. Thank you
Q: Several local universities hire a polling company to study how wide spread cheating is in online…
A: The objective is to match the type of bias this challenge would make us worry about the most.
Q: Suppose that IQ scores have a bell shape distribution with a mean of 105 and a standard deviation at…
A: Solution: Let X represent the IQ scores of students. The distribution of X is bell shape…
Q: Only about 13% of all people can wiggle their ears. Is this percent lower for millionaires? Of the…
A:
Q: this exercise, you can assume that the 14 subjects are representative of the population of adult…
A:
Q: In which of the following scenarios would it be best to use r squared (the coefficient of…
A: Coefficient of determination tells us the percentage of variation explained in the dependent…
Trending now
This is a popular solution!
Step by step
Solved in 2 steps
- The following fictitious table shows kryptonite price, in dollar per gram, t years after 2006. t= Years since 2006 0 1 2 3 4 5 6 7 8 9 10 K= Price 56 51 50 55 58 52 45 43 44 48 51 Make a quartic model of these data. Round the regression parameters to two decimal places.Hello, please help me to solve the question below.Consider this regression model: Yt = β0 + β1 Ut + β2 Vt + β3 Wt + β4 Xt + εt ; where t= 1, ..., 75.We use OLS to estimate the parameters, producing the following model:Ŷt = 1.115 + 0.790 Ut − 0.327 Vt + 0.763 Wt + 0.456 Xt (0.405) (0.178) (0.088) (0.274) (0.017) Given that:R2 = 0.941; Durbin Watson stat DW = 1.907; RSS = 0.0757.(To answer the question, use the 5% level of significance, state clearly H0 and H1 that are tested, the test statistics that are used, and interpret the decisions.) (a) Describe the concepts of unbiasedness and efficiency. State the conditions required of regression (1) in order that the OLS estimators of the model parameters possess these properties. (b) Perform the following tests on the parameters of regression (1): (i) test whether the parameters β1, β2, β3 and β4 are individually statistically significant; (ii) test the overall significance of the regression model; (iii) test whether…Statistical software was used to fit the model E(y)=β0+β1x1+β2x2 to n=20 data points. Complete parts a through h. The regression equation is Y=1676.53−940.95x1−164.58x2 Predictor Coef SE Coef T P Constant 1676.53 316.6 5.3 0.000 X1 −940.95 257.21 −3.66 0.002 X2 −164.58 231.08 −0.71 0.487 S=298.441 R-sq=57.0% R-sq(adj)=52.0% Analysis of Variance Source DF SS MS F P Regression 2 2,015,321 1,007,661 11.31 0.001 Residual Error 17 1,514,138 89,067 Total 19 3,529,459 a. What are the sample estimates of β0, β1, and β2? β0 = enter your response here β1 = enter your response here β2 = enter your response here (Type integers or decimals.)
- d. Draw the regression line on the scatter diagram using the yp points.e. Find y for x = 50 x 20 10 30 40 60 70 y 20 20 30 50 60 80(a) Obtain the regression Equation (4 decimal places) (b)Calculate R2 (4 decimak places) (c) Calculate the number of unusual residuals and number of outliers PASTA SAUCE per gram total calories and fat calories n=20 products Product Fat calories per gram Calories per gram Barilla Roasted Garlic & Onion 0.20 0.64 Barilla Tomato & Basil 0.12 0.56 Classico Tomato & Basil 0.08 0.40 Del Monte Mushroom 0.04 0.48 Five Bros Tomato & Basil 0.12 0.64 Healthy Choice Traditional 0.00 0.40 Master Choice Chunky Garden Vegetable 0.08 0.56 Meijer All Natural Meatless 0.08 0.55 Newman's Own Traditional 0.12 0.48 Paul Newman Venetian 0.12 0.48 Prego Fresh Mushroom 0.38 1.25 Prego Hearty Meat−Pepperoni 0.33 1.00 Prego Hearty Meat−Hamburger 0.29 1.00 Prego Traditional 0.33 1.17 Prego Roasted Red Pepper & Garlic 0.25 0.92 Ragu Old World Style w/meat 0.25 0.67 Ragu Roasted Red Pepper & Onion 0.20 0.86 Ragu…Compare the linear regression data for two students walking in front of a motion sensor: Bob’s walk d = 0.75t + 2 r = 0.70 Tracey’s walk d = 0.75t + 2 r = 0.95 a) How are the movements of these walkers similar? different? b) Sketch possible distance versus time graphs for Bob and Tracey.
- Kindly help me with g) h) i) although I know the answer for i) R^2 = 0.7447 and Adjusted R square 0.5989. If you could help interpret it. Here are the answers for the previous ques. for reference. (a) Thus, the multiple linear regression line is, y = (–102.7132) + 0.6054 x1 + 8.9236 x2 + 1.4375 x3 + 0.0136 x4 (b) y = (–102.7132) + 0.6054 (75) + 8.9236 (24) + 1.4375 (90) + 0.0136 (98) = (–102.7132) + 45.405 + 214.1664 + 129.375 + 1.3328 = 287.566 (c) the P-value for the overall model is 0.030302769. It is known that, if the P-value is less than or equal to the level of significance, then reject the null hypothesis. Or else, fail to reject the null hypothesis. Here, the level of significance is 0.05. Hence, the obtained P-value is less than the level of significance. Thus, the null hypothesis is rejected. Therefore, there is enough evidence to claim that the regression model is significant at 5% level of significance. (d) The mean square error is the estimate value of…Which of the following statements are true regarding the simple linear regression modely=β0+β1 x1+ε1 A. εi is a nonrandom error. B. Β0 is the slope of the regression line. C. Β1 is the y-intercept of the regression line. D. yi is a value of the dependent variable (y) and xi is a value of the independent variable (x).Given are five observations for two variables, x and y. x 1 2 3 4 5 y 4 7 7 11 13 Develop the estimated regression equation by computing the values of b0 and b1 (to 1 decimals).y=___________ + ___________xUse the estimated regression equation to predict the value of y when x=3 (to 1 decimals). y=___________
- length,x 1 2 3 4 observed y 4.4 5 6.6 7 predicted y 4.34 5.28 6.22 7.16 calculate the regression standard error, ?I am lost ont his, help! The table below contains the average public school classroom teacher's salaries, yy, for an 11-year period. If xx represents the number of years since 1990, use Excel to find a linear model for the data. Year 1990 1991 1992 1993 1994 1995 Salary 32731 33463 35888 34411 36287 36946 Year 1996 1997 1998 1999 2000 Salary 36884 40097 42184 43146 40548 With the salary given by y=mx+bm = b =Town A B C D E F GPopulation (lakh) (X ) 11 14 14 17 17 21 25No. of TV sets demanded ('000) (Y ) 15 27 27 30 34 38 46Fit a linear regression of Y on X and estimate the demand for TV sets for a city with apopulation of (a) 20 lakh and (b) 32 lakh.