The accompanying data table contains the annual high values of a stock market price index for a recent sequence of years. Test for randomness below and above the median. Use the runs test with a significance level of 0.05. What does the result suggest about the stock market as an investment consideration? Note that all data are listed in chronological order by row. Click on the icon to view the data table. Click on the icon to view the table of critical values for the number of runs G. Click here to view the positive standard normal (2) distribution table Click here to view the negative standard normal (z) distribution table Identify the null and alternative hypotheses. Choose the correct answer below. A. Ho: The stock market price index annual highs are in a random sequence. H₁: The stock market price index annual highs are in a sequence that is not random. OB. Ho: The median of the stock price index annual highs is equal to 2305.5. H₁: The median of the stock price index annual highs is not equal to 2305.5. OC. Ho: The stock market price index annual highs are in a sequence that is not random. H₁: The stock market price index annual highs are in a random sequence. OD. The requirements of the runs test are not met by this data. Compute the test statistic. Select the correct choice below and, if necessary, fill in the answer box to complete your choice. OA. G=(Round to two decimal places as needed.) B. z (Round to two decimal places as needed.) OC. The requirements of the runs test are not met by this data. Find the critical values. Select the correct choice below and, if necessary, fill in the answer box to complete your choice. OA. G= (Round to two decimal places as needed. Use a comma to separate answers as needed.) Stock Price Index Annual Highs 4 1309 729 821 1071 611 500 1235 818 1674 350 1040 491 D 1568 1151 335 1695 1617 886 1783 2017 2594 1168 1513 3248 3810 4051 4047 3574 5124 1352 4673 7807 13666 10997 10279 18200 11348 7960 5614 9173 4341 7372 13995 4720 12672 4321 OB. 2= (Round to two decimal places as needed. Use a comma to separate answers as needed.) OC. The requirements of the runs test are not met by this data. State the conclusion. Choose the correct answer below. OA. Reject Ho. There is sufficient evidence to conclude that the stock market price index annual highs data are not in a random sequence. OB. Reject Ho. There is sufficient evidence to conclude that the stock market price index annual highs median is equal to 2305.5. Do not raiart H Thara le insufficient avirlanca in conclude that the stock market nrica indav annual hinhe data are not in a random cananca 4√√ II, (0,0) ± More Print Done X
The accompanying data table contains the annual high values of a stock market price index for a recent sequence of years. Test for randomness below and above the median. Use the runs test with a significance level of 0.05. What does the result suggest about the stock market as an investment consideration? Note that all data are listed in chronological order by row. Click on the icon to view the data table. Click on the icon to view the table of critical values for the number of runs G. Click here to view the positive standard normal (2) distribution table Click here to view the negative standard normal (z) distribution table Identify the null and alternative hypotheses. Choose the correct answer below. A. Ho: The stock market price index annual highs are in a random sequence. H₁: The stock market price index annual highs are in a sequence that is not random. OB. Ho: The median of the stock price index annual highs is equal to 2305.5. H₁: The median of the stock price index annual highs is not equal to 2305.5. OC. Ho: The stock market price index annual highs are in a sequence that is not random. H₁: The stock market price index annual highs are in a random sequence. OD. The requirements of the runs test are not met by this data. Compute the test statistic. Select the correct choice below and, if necessary, fill in the answer box to complete your choice. OA. G=(Round to two decimal places as needed.) B. z (Round to two decimal places as needed.) OC. The requirements of the runs test are not met by this data. Find the critical values. Select the correct choice below and, if necessary, fill in the answer box to complete your choice. OA. G= (Round to two decimal places as needed. Use a comma to separate answers as needed.) Stock Price Index Annual Highs 4 1309 729 821 1071 611 500 1235 818 1674 350 1040 491 D 1568 1151 335 1695 1617 886 1783 2017 2594 1168 1513 3248 3810 4051 4047 3574 5124 1352 4673 7807 13666 10997 10279 18200 11348 7960 5614 9173 4341 7372 13995 4720 12672 4321 OB. 2= (Round to two decimal places as needed. Use a comma to separate answers as needed.) OC. The requirements of the runs test are not met by this data. State the conclusion. Choose the correct answer below. OA. Reject Ho. There is sufficient evidence to conclude that the stock market price index annual highs data are not in a random sequence. OB. Reject Ho. There is sufficient evidence to conclude that the stock market price index annual highs median is equal to 2305.5. Do not raiart H Thara le insufficient avirlanca in conclude that the stock market nrica indav annual hinhe data are not in a random cananca 4√√ II, (0,0) ± More Print Done X

Glencoe Algebra 1, Student Edition, 9780079039897, 0079039898, 2018
18th Edition
ISBN:9780079039897
Author:Carter
Publisher:Carter
Chapter10: Statistics
Section10.4: Distributions Of Data
Problem 19PFA

Related questions
Question
J 1
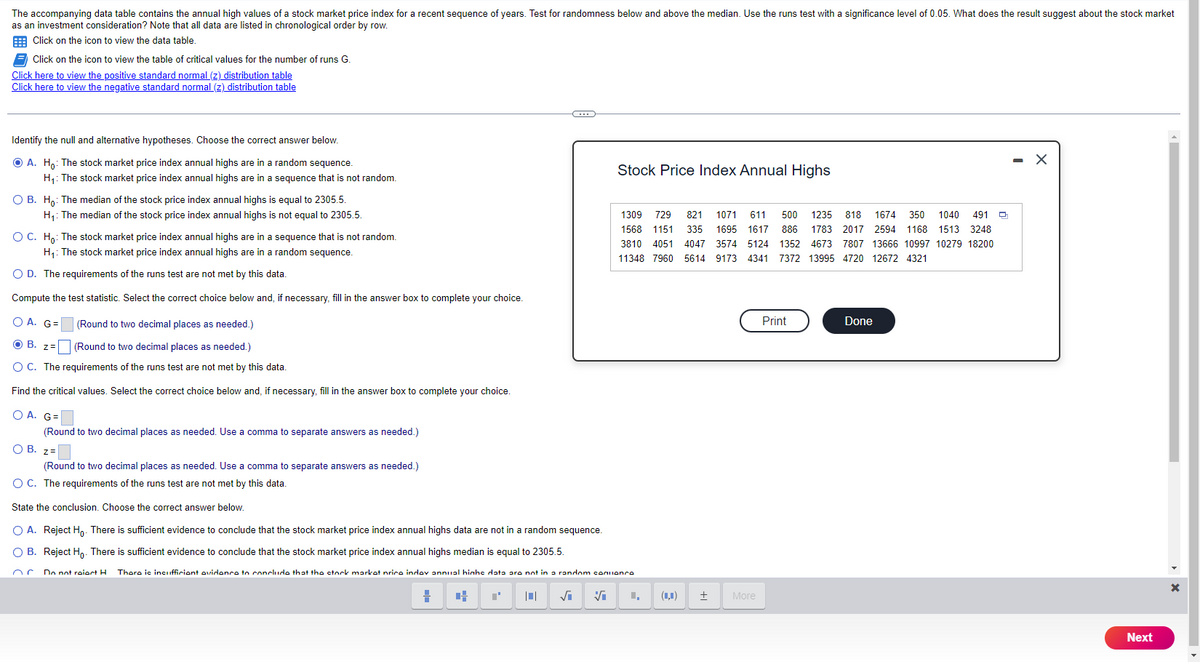
Transcribed Image Text:The accompanying data table contains the annual high values of a stock market price index for a recent sequence of years. Test for randomness below and above the median. Use the runs test with a significance level of 0.05. What does the result suggest about the stock market
as an investment consideration? Note that all data are listed in chronological order by row.
Click on the icon to view the data table.
Click on the icon to view the table of critical values for the number of runs G.
Click here to view the positive standard normal (z) distribution table
Click here to view the negative standard normal (z) distribution table
Identify the null and alternative hypotheses. Choose the correct answer below.
ⒸA. Ho: The stock market price index annual highs are in a random sequence.
H₁: The stock market price index annual highs are in a sequence that is not random.
O B. Ho: The median of the stock price index annual highs is equal to 2305.5.
H₁: The median of the stock price index annual highs is not equal to 2305.5.
O C. Ho: The stock market price index annual highs are in a sequence that is not random.
H₁: The stock market price index annual highs are in a random sequence.
O D. The requirements of the runs test are not met by this data.
Compute the test statistic. Select the correct choice below and, if necessary, fill in the answer box to complete your choice.
OA. G=
(Round to two decimal places as needed.)
O B. Z=
(Round to two decimal places as needed.)
O C. The requirements of the runs test are not met by this data.
Find the critical values. Select the correct choice below and, if necessary, fill in the answer box to complete your choice.
O A. G=
(Round to two decimal places as needed. Use a comma to separate answers as needed.)
O B. z=
(Round to two decimal places as needed. Use a comma to separate answers as needed.)
O C. The requirements of the runs test are not met by this data.
State the conclusion. Choose the correct answer below.
O A. Reject Ho. There is sufficient evidence to conclude that the stock market price index annual highs data are not in a random sequence.
OB. Reject Ho. There is sufficient evidence to conclude that the stock market price index annual highs median is equal to 2305.5.
Do not raiart H
=
Stock Price Index Annual Highs
There is incufficient evidence to conclude that the stock market price indlev annual hinhe data are not in a random contionco
C T |0| √i ✔
1309 729 821 1071 611 500 1235 818 1674 350 1040 491 Q
1568 1151 335 1695 1617 886 1783 2017 2594 1168 1513 3248
3810 4051 4047 3574 5124 1352 4673 7807 13666 10997 10279 18200
11348 7960 5614 9173 4341 7372 13995 4720 12672 4321
(4) ±
More
Print
Done
Next
X
Expert Solution
This question has been solved!
Explore an expertly crafted, step-by-step solution for a thorough understanding of key concepts.

This is a popular solution!

Trending now
This is a popular solution!

Step by step
Solved in 5 steps

Recommended textbooks for you
Glencoe Algebra 1, Student Edition, 9780079039897…
Algebra
ISBN:
9780079039897
Author:
Carter
Publisher:
McGraw Hill
Glencoe Algebra 1, Student Edition, 9780079039897…
Algebra
ISBN:
9780079039897
Author:
Carter
Publisher:
McGraw Hill