A researcher studying psychological well-being between those with depression, anxiety, or mood disorders and recruits 20 individuals with depression, 20 with anxiety, and 20 with mood disorders, and measures their psychological adjustment. Which type of statistical test would be appropriate for this design? One-way ANOVA Chi-square Correlation/Regression Dependent t-test Independent t-test
A researcher studying psychological well-being between those with depression, anxiety, or mood disorders and recruits 20 individuals with depression, 20 with anxiety, and 20 with mood disorders, and measures their psychological adjustment. Which type of statistical test would be appropriate for this design? One-way ANOVA Chi-square Correlation/Regression Dependent t-test Independent t-test

College Algebra (MindTap Course List)
12th Edition
ISBN:9781305652231
Author:R. David Gustafson, Jeff Hughes
Publisher:R. David Gustafson, Jeff Hughes
Chapter8: Sequences, Series, And Probability
Section8.7: Probability
Problem 58E: What is meant by the sample space of an experiment?

Related questions
Question
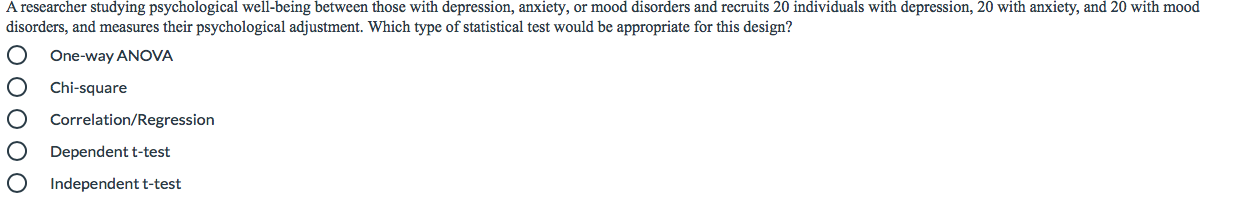
Transcribed Image Text:A researcher studying psychological well-being between those with depression, anxiety, or mood disorders and recruits 20 individuals with depression, 20 with anxiety, and 20 with mood
disorders, and measures their psychological adjustment. Which type of statistical test would be appropriate for this design?
One-way ANOVA
Chi-square
Correlation/Regression
Dependent t-test
Independent t-test
Expert Solution
This question has been solved!
Explore an expertly crafted, step-by-step solution for a thorough understanding of key concepts.

Step by step
Solved in 2 steps

Recommended textbooks for you
College Algebra (MindTap Course List)
Algebra
ISBN:
9781305652231
Author:
R. David Gustafson, Jeff Hughes
Publisher:
Cengage Learning

College Algebra (MindTap Course List)
Algebra
ISBN:
9781305652231
Author:
R. David Gustafson, Jeff Hughes
Publisher:
Cengage Learning