A researcher takes sample temperatures in Fahrenheit of 20 days from Hartford and 18 days from Denver Use the sample data shown in the table. Test the claim that the mean temperature in Hartford is different than the mean temperature in Denver Use a significance level of o 0.10. Assume the populations are approximately normally distributed with unequal variances. Note that list 1 is longer than list 2, so these are 2 independent samples, not matched pairs.
A researcher takes sample temperatures in Fahrenheit of 20 days from Hartford and 18 days from Denver Use the sample data shown in the table. Test the claim that the mean temperature in Hartford is different than the mean temperature in Denver Use a significance level of o 0.10. Assume the populations are approximately normally distributed with unequal variances. Note that list 1 is longer than list 2, so these are 2 independent samples, not matched pairs.

Glencoe Algebra 1, Student Edition, 9780079039897, 0079039898, 2018
18th Edition
ISBN:9780079039897
Author:Carter
Publisher:Carter
Chapter10: Statistics
Section10.3: Measures Of Spread
Problem 1GP

Related questions
Topic Video
Question
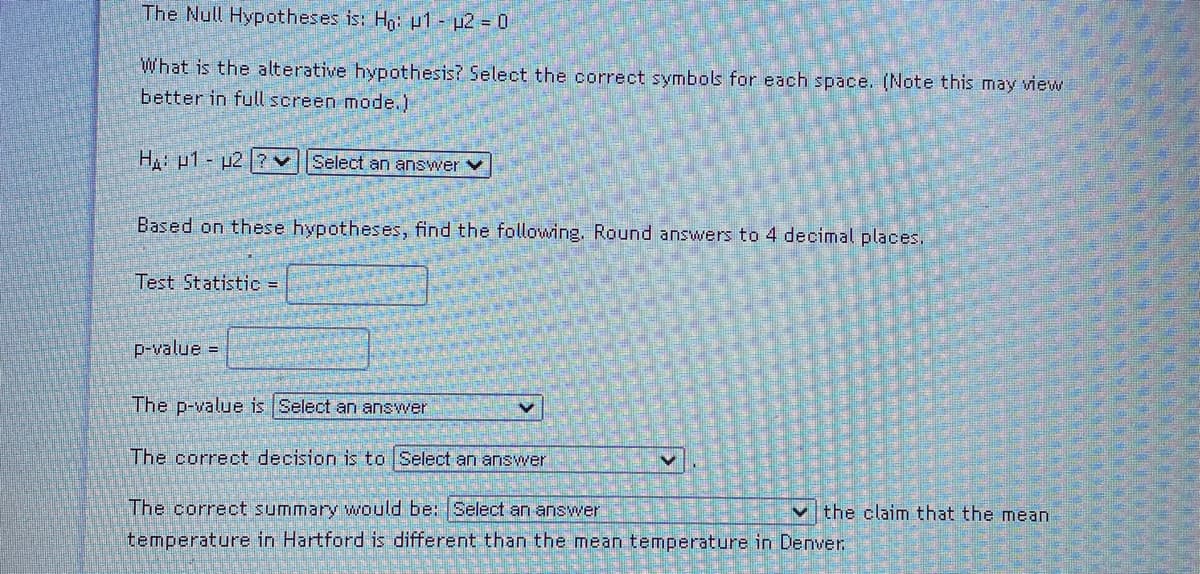
Transcribed Image Text:The Null Hypotheses is: Hg: 1 - p2 = 0
What is the alterative hypothesis? Select the correct symbols for each space. (Note this may view
better in full screen mode.)
H: p1 - µ2 ?vSelect an answer v
Based on these hypotheses, find the following. Round answers to 4 decimal places.
Test Statistic =
P-value =D
The p-value is Select an answer
The correct decision is to Select an answer
The correct summary would be: Select an answer
the claim that the mean
temperature in Hartford is different than the mean temperature in Denver.
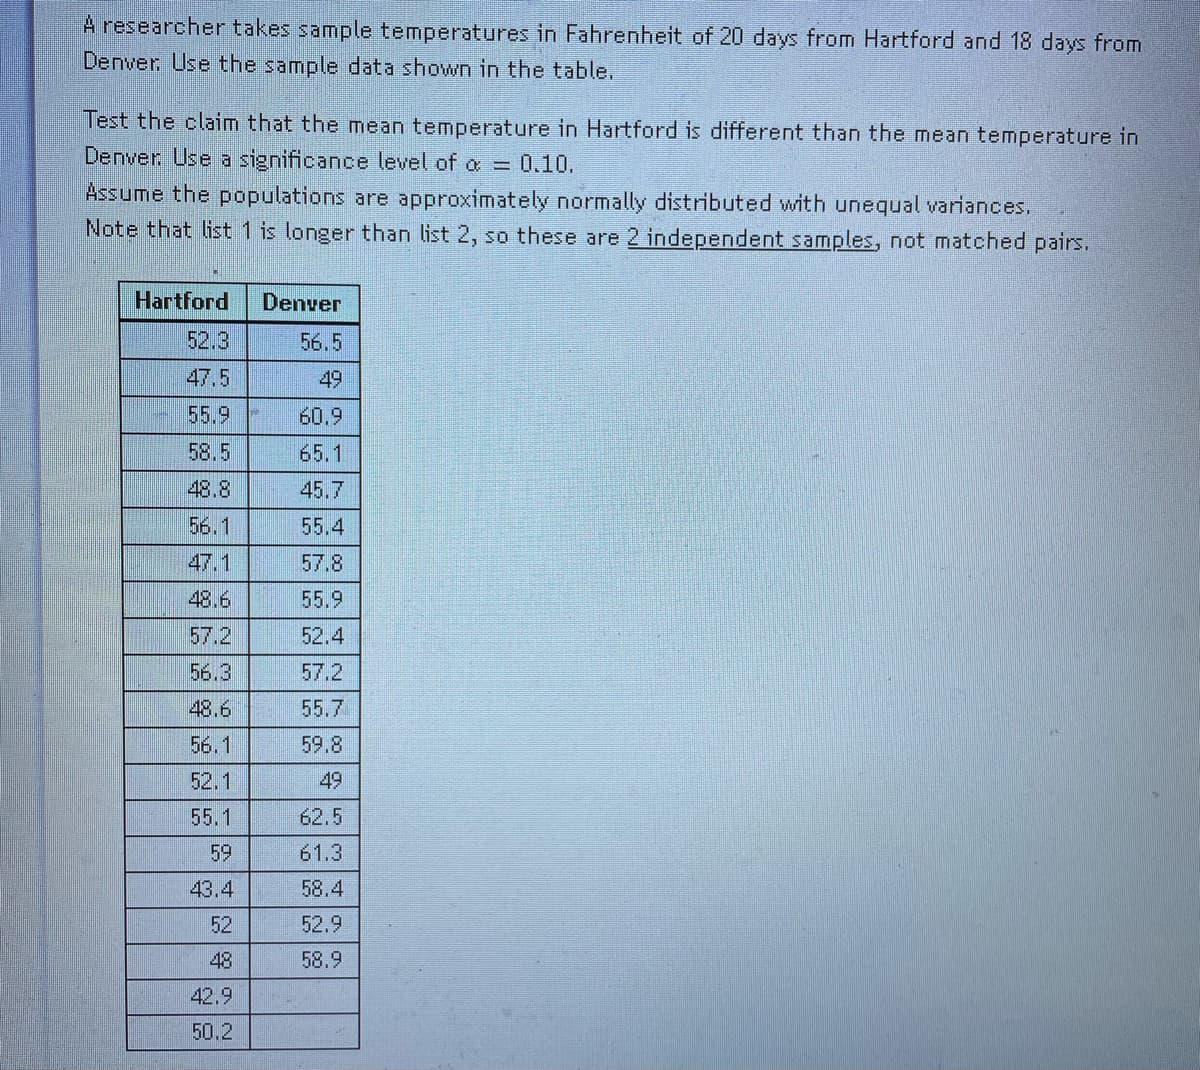
Transcribed Image Text:A researcher takes sample temperatures in Fahrenheit of 20 days from Hartford and 18 days from
Denver Use the sample data shown in the table.
Test the claim that the mean temperature in Hartford is different than the mean temperature in
Denver Use a significance level of a = 0.10.
Assume the populations are approximately normally distributed with unequal variances.
Note that list 1 is longer than list 2, so these are 2 independent samples, not matched pairs.
Hartford
Denver
52.3
56.5
47,5
49
55.9
60.9
58.5
65.1
48.8
45.7
56.1
55.4
47.1
57.8
48.6
55.9
57.2
52.4
56.3
57.2
48.6
55.7
56.1
59.8
52.1
49
55.1
62.5
59
61.3
43.4
58.4
52
52.9
48
58.9
42.9
50.2
Expert Solution
This question has been solved!
Explore an expertly crafted, step-by-step solution for a thorough understanding of key concepts.

Step by step
Solved in 2 steps with 1 images

Knowledge Booster


Learn more about
Need a deep-dive on the concept behind this application? Look no further. Learn more about this topic, statistics and related others by exploring similar questions and additional content below.Recommended textbooks for you
Glencoe Algebra 1, Student Edition, 9780079039897…
Algebra
ISBN:
9780079039897
Author:
Carter
Publisher:
McGraw Hill
Glencoe Algebra 1, Student Edition, 9780079039897…
Algebra
ISBN:
9780079039897
Author:
Carter
Publisher:
McGraw Hill