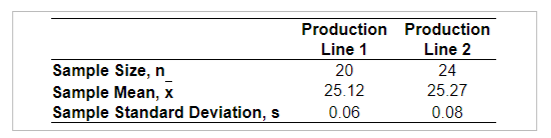
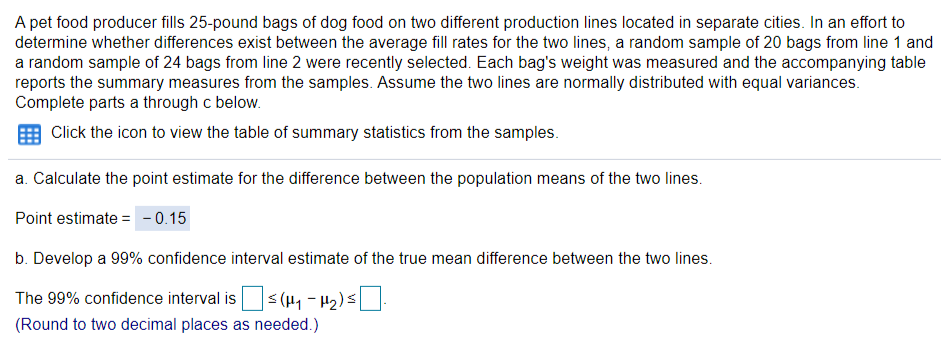
A pet food producer fills 25-pound bags of dog food on two different production lines located in separate cities. In an effort to determine whether differences exist between the average fill rates for the two lines, a random sample of 20 bags from line 1 and a random sample of 24 bags from line 2 were recently selected. Each bag's weight was measured and the accompanying table reports the summary measures from the samples. Assume the two lines are normally distributed with equal variances. Complete parts a through c below. Click the icon to view the table of summary statistics from the samples. a. Calculate the point estimate for the difference between the population means of the two lines. Point estimate = - 0.15 b. Develop a 99% confidence interval estimate of the true mean difference between the two lines. The 99% confidence interval iss (µ1 – H2) < (Round to two decimal places as needed.)


Angles in Circles
Angles within a circle are feasible to create with the help of different properties of the circle such as radii, tangents, and chords. The radius is the distance from the center of the circle to the circumference of the circle. A tangent is a line made perpendicular to the radius through its endpoint placed on the circle as well as the line drawn at right angles to a tangent across the point of contact when the circle passes through the center of the circle. The chord is a line segment with its endpoints on the circle. A secant line or secant is the infinite extension of the chord.
Arcs in Circles
A circular arc is the arc of a circle formed by two distinct points. It is a section or segment of the circumference of a circle. A straight line passing through the center connecting the two distinct ends of the arc is termed a semi-circular arc.
If using Excel, please show work.
Help me fast.....I will give Upvote....


Trending now
This is a popular solution!

Step by step
Solved in 2 steps


