A researcher wanted to determine if carpeted rooms contain more bacteria than uncarpeted rooms. The table shows the results for the number of bacteria per cubic foot for both Full data setO Types of rooms. Carpeted 11.9 10.9 9.5 14.7 14 Uncarpeted 7.4 7.5 15.9 4.4 4.9 11 11.5 8.9 11.6 7 4.3 Determine whether carpeted rooms have more bacteria than uncarpeted rooms at the a = 0.05 level of significance. Normal probability plots indicate that the data are approximately normal and boxplots indicate that there are no putliers. State the null and alternative hypotheses. Let population 1 be carpeted rooms and population 2 be uncarpeted rooms. O A. Ho: H1 =H2 H: H H2 O D. Ho: H1 = H2
A researcher wanted to determine if carpeted rooms contain more bacteria than uncarpeted rooms. The table shows the results for the number of bacteria per cubic foot for both Full data setO Types of rooms. Carpeted 11.9 10.9 9.5 14.7 14 Uncarpeted 7.4 7.5 15.9 4.4 4.9 11 11.5 8.9 11.6 7 4.3 Determine whether carpeted rooms have more bacteria than uncarpeted rooms at the a = 0.05 level of significance. Normal probability plots indicate that the data are approximately normal and boxplots indicate that there are no putliers. State the null and alternative hypotheses. Let population 1 be carpeted rooms and population 2 be uncarpeted rooms. O A. Ho: H1 =H2 H: H H2 O D. Ho: H1 = H2

Glencoe Algebra 1, Student Edition, 9780079039897, 0079039898, 2018
18th Edition
ISBN:9780079039897
Author:Carter
Publisher:Carter
Chapter10: Statistics
Section10.6: Summarizing Categorical Data
Problem 23PPS

Related questions
Question
Homework help
- Report the test statistic from the technology output, T=
- What is P Value
- To state the appropriate conclusion, compare the P-value to the level of significance a
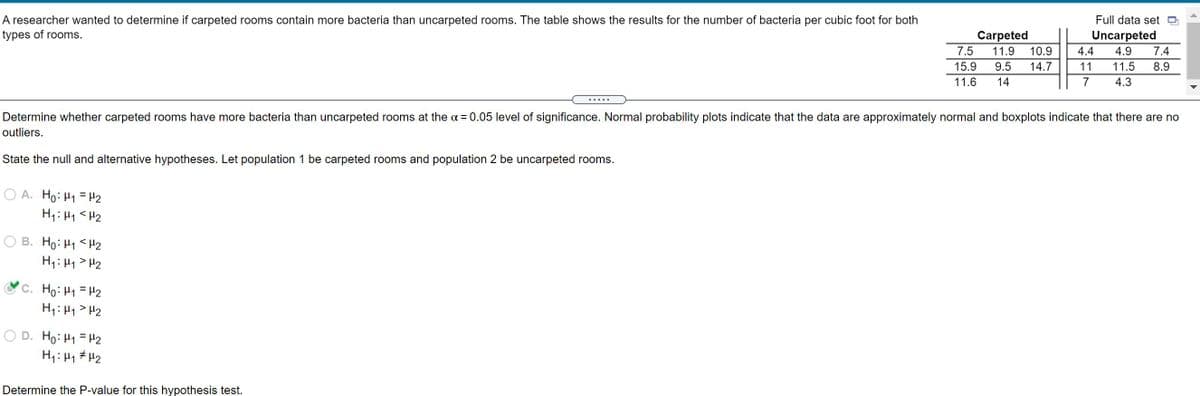
Transcribed Image Text:A researcher wanted to determine if carpeted rooms contain more bacteria than uncarpeted rooms. The table shows the results for the number of bacteria per cubic foot for both
Full data set D
types of rooms.
Carpeted
7.5
Uncarpeted
11.9
10.9
4.4
4.9
7.4
15.9
9.5
14.7
11
11.5
8.9
11.6
14
7
4.3
Determine whether carpeted rooms have more bacteria than uncarpeted rooms at the a = 0.05 level of significance. Normal probability plots indicate that the data are approximately normal and boxplots indicate that there are no
outliers.
State the null and alternative hypotheses. Let population 1 be carpeted rooms and population 2 be uncarpeted rooms.
O A. Ho: H1 = H2
H1: 41 <H2
B. Ho: H1 <H2
H1: H1 > H2
C. Ho: H1 = H2
H1: H1> H2
H1: 41# H2
ZH = ht :0H
Determine the P-value for this hypothesis test.
Expert Solution
This question has been solved!
Explore an expertly crafted, step-by-step solution for a thorough understanding of key concepts.

This is a popular solution!

Trending now
This is a popular solution!

Step by step
Solved in 2 steps with 3 images

Recommended textbooks for you
Glencoe Algebra 1, Student Edition, 9780079039897…
Algebra
ISBN:
9780079039897
Author:
Carter
Publisher:
McGraw Hill

Linear Algebra: A Modern Introduction
Algebra
ISBN:
9781285463247
Author:
David Poole
Publisher:
Cengage Learning

Big Ideas Math A Bridge To Success Algebra 1: Stu…
Algebra
ISBN:
9781680331141
Author:
HOUGHTON MIFFLIN HARCOURT
Publisher:
Houghton Mifflin Harcourt
Glencoe Algebra 1, Student Edition, 9780079039897…
Algebra
ISBN:
9780079039897
Author:
Carter
Publisher:
McGraw Hill
Linear Algebra: A Modern Introduction
Algebra
ISBN:
9781285463247
Author:
David Poole
Publisher:
Cengage Learning
Big Ideas Math A Bridge To Success Algebra 1: Stu…
Algebra
ISBN:
9781680331141
Author:
HOUGHTON MIFFLIN HARCOURT
Publisher:
Houghton Mifflin Harcourt

Holt Mcdougal Larson Pre-algebra: Student Edition…
Algebra
ISBN:
9780547587776
Author:
HOLT MCDOUGAL
Publisher:
HOLT MCDOUGAL