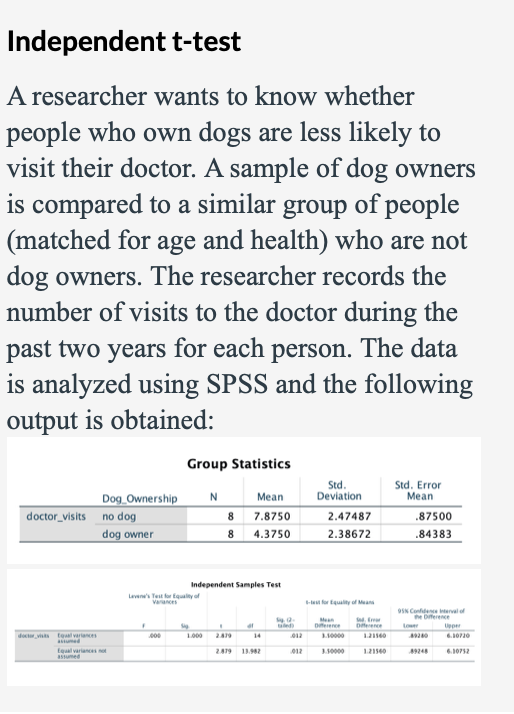
A researcher wants to know whether people who own dogs are less likely to visit their doctor. A sample of dog owners is compared to a similar group of people (matched for age and health) who are not dog owners. The researcher records the number of visits to the doctor during the past two years for each person. The data is analyzed using SPSS and the following output is obtained: Group Statistics Dog Ownership Std. Deviation Std. Error Mean Mean doctor_visits no dog 8. 7.8750 2.47487 .87500 dog owner 8 4.3750 2.38672 .84383
A researcher wants to know whether people who own dogs are less likely to visit their doctor. A sample of dog owners is compared to a similar group of people (matched for age and health) who are not dog owners. The researcher records the number of visits to the doctor during the past two years for each person. The data is analyzed using SPSS and the following output is obtained: Group Statistics Dog Ownership Std. Deviation Std. Error Mean Mean doctor_visits no dog 8. 7.8750 2.47487 .87500 dog owner 8 4.3750 2.38672 .84383

Glencoe Algebra 1, Student Edition, 9780079039897, 0079039898, 2018
18th Edition
ISBN:9780079039897
Author:Carter
Publisher:Carter
Chapter10: Statistics
Section10.4: Distributions Of Data
Problem 19PFA

Related questions
Topic Video
Question
What is the t-value rounded to two decimals?
What is your df?
What is your p-value?
What do you conclude? Are people significantly less likely to visit the doctor when they own dogs?
Transcribed Image Text:Independent t-test
A researcher wants to know whether
people who own dogs are less likely to
visit their doctor. A sample of dog owners
is compared to a similar group
(matched for age and health) who are not
of people
dog owners. The researcher records the
number of visits to the doctor during the
past two years for each person. The data
is analyzed using SPSS and the following
output is obtained:
Group Statistics
Std.
Deviation
Std. Error
Mean
Dog_Ownership
N
Mean
doctor_visits no dog
8
7.8750
2.47487
.87500
dog owner
8 4.3750
2.38672
.84383
Independent Samples Test
Lavene's Test for Equality of
Varances
la for tquality of Muan
OSN Confde tervalo
he Dierence
Mean
Dierene
Derence
Loer
Upper
doctvis teal vartances
aumed
L000
14
L10000
Equal variances not
asumed
2.479 13.982
012
1.0000
12140
6.10752
Expert Solution
This question has been solved!
Explore an expertly crafted, step-by-step solution for a thorough understanding of key concepts.

Step by step
Solved in 2 steps

Knowledge Booster


Learn more about
Need a deep-dive on the concept behind this application? Look no further. Learn more about this topic, statistics and related others by exploring similar questions and additional content below.Recommended textbooks for you
Glencoe Algebra 1, Student Edition, 9780079039897…
Algebra
ISBN:
9780079039897
Author:
Carter
Publisher:
McGraw Hill
Glencoe Algebra 1, Student Edition, 9780079039897…
Algebra
ISBN:
9780079039897
Author:
Carter
Publisher:
McGraw Hill