A researcher was interested in comparing the amount of time spent studying baboons by women and men from a group of anthropologists. Independent simple random samples of 35 women and 36 men were selected, and each person was asked how many hours they had studied the baboons during the previous week. The summary is shown in the table. Women n, = 35 women ī, - 17.1 hours E - 17.2 hours S - 1.5 hours Men n2 = 36 men 52 - 2.3 hours Use a 0.1 significance level to test the claim that the mean amount of time spent studying baboons by women is smaller than it is for men.
A researcher was interested in comparing the amount of time spent studying baboons by women and men from a group of anthropologists. Independent simple random samples of 35 women and 36 men were selected, and each person was asked how many hours they had studied the baboons during the previous week. The summary is shown in the table. Women n, = 35 women ī, - 17.1 hours E - 17.2 hours S - 1.5 hours Men n2 = 36 men 52 - 2.3 hours Use a 0.1 significance level to test the claim that the mean amount of time spent studying baboons by women is smaller than it is for men.

Glencoe Algebra 1, Student Edition, 9780079039897, 0079039898, 2018
18th Edition
ISBN:9780079039897
Author:Carter
Publisher:Carter
Chapter10: Statistics
Section10.4: Distributions Of Data
Problem 19PFA

Related questions

Question
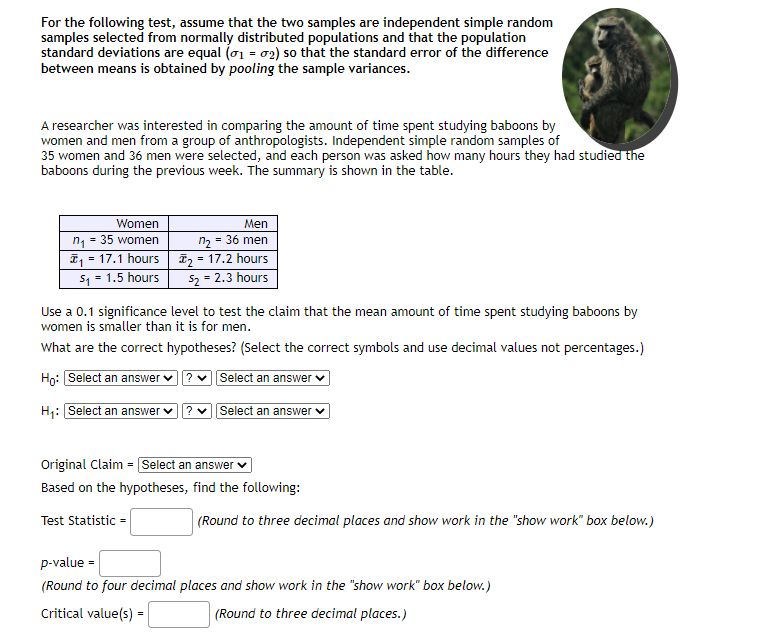
Transcribed Image Text:For the following test, assume that the two samples are independent simple random
samples selected from normally distributed populations and that the population
standard deviations are equal (01 = 02) so that the standard error of the difference
between means is obtained by pooling the sample variances.
A researcher was interested in comparing the amount of time spent studying baboons by
women and men from a group of anthropologists. Independent simple random samples of
35 women and 36 men were selected, and each person was asked how many hours they had studied the
baboons during the previous week. The summary is shown in the table.
Women
Men
n - 35 women
= 36 men
n2
I, = 17.1 hours , - 17.2 hours
52 = 2.3 hours
%3D
51 = 1.5 hours
Use a 0.1 significance level to test the claim that the mean amount of time spent studying baboons by
women is smaller than it is for men.
What are the correct hypotheses? (Select the correct symbols and use decimal values not percentages.)
Ho: Select an answer v ?
Select an answer
H: Select an answer v
Select an answer v
Original Claim
Select an answer
Based on the hypotheses, find the following:
Test Statistic =
(Round to three decimal places and show work in the "show work" box below.)
p-value =
(Round to four decimal places and show work in the "show work" box below.)
Critical value(s) =
|(Round to three decimal places.)
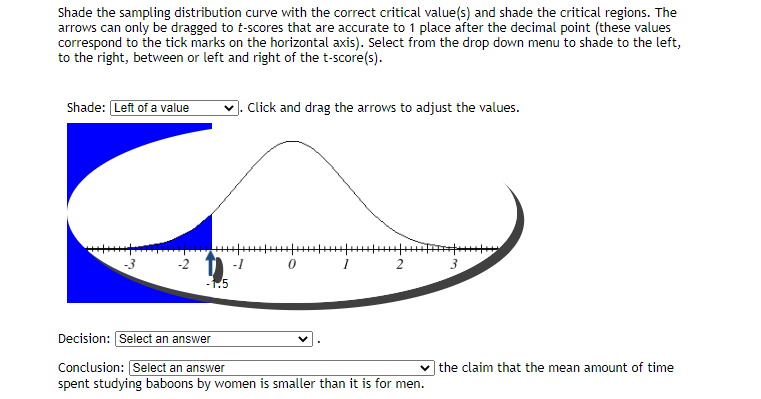
Transcribed Image Text:Shade the sampling distribution curve with the correct critical value(s) and shade the critical regions. The
arrows can only be dragged to t-scores that are accurate to 1 place after the decimal point (these values
correspond to the tick marks on the horizontal axis). Select from the drop down menu to shade to the left,
to the right, between or left and right of the t-score(s).
Shade: Left of a value
Click and drag the arrows to adjust the values.
-2
-1
2
-1.5
Decision: Select an answer
Conclusion: [Select an answer
spent studying baboons by women is smaller than it is for men.
the claim that the mean amount of time
Expert Solution
This question has been solved!
Explore an expertly crafted, step-by-step solution for a thorough understanding of key concepts.

This is a popular solution!

Trending now
This is a popular solution!

Step by step
Solved in 2 steps with 1 images

Knowledge Booster


Learn more about
Need a deep-dive on the concept behind this application? Look no further. Learn more about this topic, statistics and related others by exploring similar questions and additional content below.Recommended textbooks for you
Glencoe Algebra 1, Student Edition, 9780079039897…
Algebra
ISBN:
9780079039897
Author:
Carter
Publisher:
McGraw Hill
Glencoe Algebra 1, Student Edition, 9780079039897…
Algebra
ISBN:
9780079039897
Author:
Carter
Publisher:
McGraw Hill