The data in the accompanying table are from a paper. Suppose that each person in a random sample of 47 male students and in a random sample of 89 female students at a particular college was classified according to gender and whether they usually or rarely eat three meals a day. Usually Eat 3 Meals a Day Rarely Eat 3 Meals a Day Male 25 22 Female 37 52
The data in the accompanying table are from a paper. Suppose that each person in a random sample of 47 male students and in a random sample of 89 female students at a particular college was classified according to gender and whether they usually or rarely eat three meals a day. Usually Eat 3 Meals a Day Rarely Eat 3 Meals a Day Male 25 22 Female 37 52

Holt Mcdougal Larson Pre-algebra: Student Edition 2012
1st Edition
ISBN:9780547587776
Author:HOLT MCDOUGAL
Publisher:HOLT MCDOUGAL
Chapter11: Data Analysis And Probability
Section: Chapter Questions
Problem 8CR

Related questions

Question
100%
Transcribed Image Text:A 14.2 Test Homogeneity and Indpi x
b The data summarized in the acco X
G screenshot screen on windows -
A webassign.net/web/Student/Assignment-Responses/last?dep=25472461
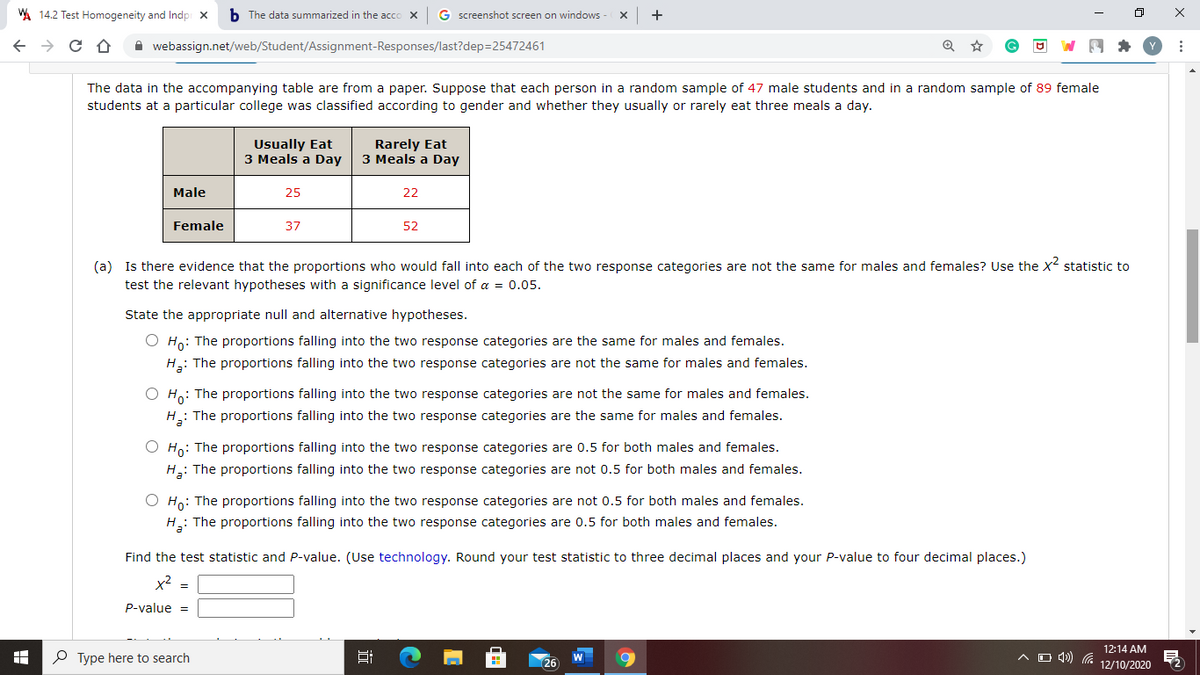
The data in the accompanying table are from a paper. Suppose that each person in a random sample of 47 male students and in a random sample of 89 female
students at a particular college was classified according to gender and whether they usually or rarely eat three meals a day.
Usually Eat
3 Meals a Day
Rarely Eat
3 Meals a Day
Male
25
22
Female
37
52
(a) Is there evidence that the proportions who would fall into each of the two response categories are not the same for males and females? Use the X statistic to
test the relevant hypotheses with a significance level of a = 0.05.
State the appropriate null and alternative hypotheses.
O Ho: The proportions falling into the two response categories are the same for males and females.
H3: The proportions falling into the two response categories are not the same for males and females.
O H: The proportions falling into the two response categories are not the same for males and females.
H: The proportions falling into the two response categories are the same for males and females.
O Ho: The proportions falling into the two response categories are 0.5 for both males and females.
H: The proportions falling into the two response categories are not 0.5 for both males and females.
O Ho: The proportions falling into the two response categories are not 0.5 for both males and females.
H: The proportions falling into the two response categories are 0.5 for both males and females.
Find the test statistic and P-value. (Use technology. Round your test statistic to three decimal places and your P-value to four decimal places.)
x2
P-value =
12:14 AM
P Type here to search
A D 4)
26
12/10/2020
近
Expert Solution
This question has been solved!
Explore an expertly crafted, step-by-step solution for a thorough understanding of key concepts.

This is a popular solution!

Trending now
This is a popular solution!

Step by step
Solved in 4 steps with 3 images

Knowledge Booster


Learn more about
Need a deep-dive on the concept behind this application? Look no further. Learn more about this topic, statistics and related others by exploring similar questions and additional content below.Recommended textbooks for you
Holt Mcdougal Larson Pre-algebra: Student Edition…
Algebra
ISBN:
9780547587776
Author:
HOLT MCDOUGAL
Publisher:
HOLT MCDOUGAL

Algebra & Trigonometry with Analytic Geometry
Algebra
ISBN:
9781133382119
Author:
Swokowski
Publisher:
Cengage

Glencoe Algebra 1, Student Edition, 9780079039897…
Algebra
ISBN:
9780079039897
Author:
Carter
Publisher:
McGraw Hill
Holt Mcdougal Larson Pre-algebra: Student Edition…
Algebra
ISBN:
9780547587776
Author:
HOLT MCDOUGAL
Publisher:
HOLT MCDOUGAL
Algebra & Trigonometry with Analytic Geometry
Algebra
ISBN:
9781133382119
Author:
Swokowski
Publisher:
Cengage
Glencoe Algebra 1, Student Edition, 9780079039897…
Algebra
ISBN:
9780079039897
Author:
Carter
Publisher:
McGraw Hill