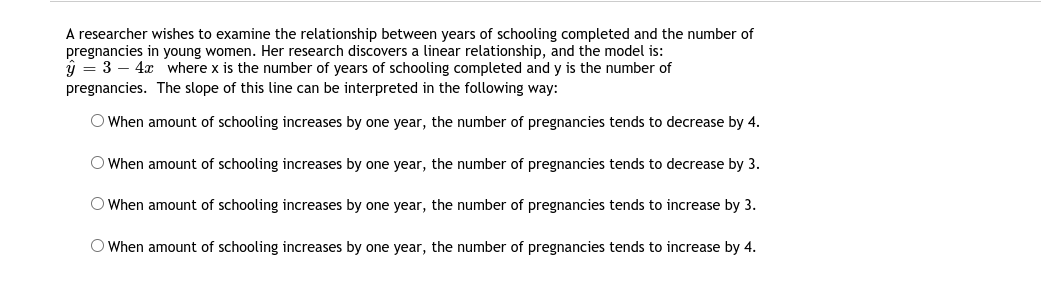
A researcher wishes to examine the relationship between years of schooling completed and the number of pregnancies in young women. Her research discovers a linear relationship, and the model is: ý = 3 – 4x where x is the number of years of schooling completed and y is the number of pregnancies. The slope of this line can be interpreted in the following way: O When amount of schooling increases by one year, the number of pregnancies tends to decrease by 4. O When amount of schooling increases by one year, the number of pregnancies tends to decrease by 3. O When amount of schooling increases by one year, the number of pregnancies tends to increase by 3. O When amount of schooling increases by one year, the number of pregnancies tends to increase by 4.
A researcher wishes to examine the relationship between years of schooling completed and the number of pregnancies in young women. Her research discovers a linear relationship, and the model is: ý = 3 – 4x where x is the number of years of schooling completed and y is the number of pregnancies. The slope of this line can be interpreted in the following way: O When amount of schooling increases by one year, the number of pregnancies tends to decrease by 4. O When amount of schooling increases by one year, the number of pregnancies tends to decrease by 3. O When amount of schooling increases by one year, the number of pregnancies tends to increase by 3. O When amount of schooling increases by one year, the number of pregnancies tends to increase by 4.

College Algebra
7th Edition
ISBN:9781305115545
Author:James Stewart, Lothar Redlin, Saleem Watson
Publisher:James Stewart, Lothar Redlin, Saleem Watson
Chapter1: Equations And Graphs
Section1.3: Lines
Problem 92E

Related questions

Topic Video
Question
Transcribed Image Text:A researcher wishes to examine the relationship between years of schooling completed and the number of
pregnancies in young women. Her research discovers a linear relationship, and the model is:
ý = 3 – 4x where x is the number of years of schooling completed and y is the number of
pregnancies. The slope of this line can be interpreted in the following way:
O When amount of schooling increases by one year, the number of pregnancies tends to decrease by 4.
O When amount of schooling increases by one year, the number of pregnancies tends to decrease by 3.
O When amount of schooling increases by one year, the number of pregnancies tends to increase by 3.
O When amount of schooling increases by one year, the number of pregnancies tends to increase by 4.
Expert Solution
This question has been solved!
Explore an expertly crafted, step-by-step solution for a thorough understanding of key concepts.

This is a popular solution!

Trending now
This is a popular solution!

Step by step
Solved in 2 steps with 2 images

Knowledge Booster


Learn more about
Need a deep-dive on the concept behind this application? Look no further. Learn more about this topic, statistics and related others by exploring similar questions and additional content below.Recommended textbooks for you
College Algebra
Algebra
ISBN:
9781305115545
Author:
James Stewart, Lothar Redlin, Saleem Watson
Publisher:
Cengage Learning

Algebra and Trigonometry (MindTap Course List)
Algebra
ISBN:
9781305071742
Author:
James Stewart, Lothar Redlin, Saleem Watson
Publisher:
Cengage Learning

Big Ideas Math A Bridge To Success Algebra 1: Stu…
Algebra
ISBN:
9781680331141
Author:
HOUGHTON MIFFLIN HARCOURT
Publisher:
Houghton Mifflin Harcourt
College Algebra
Algebra
ISBN:
9781305115545
Author:
James Stewart, Lothar Redlin, Saleem Watson
Publisher:
Cengage Learning
Algebra and Trigonometry (MindTap Course List)
Algebra
ISBN:
9781305071742
Author:
James Stewart, Lothar Redlin, Saleem Watson
Publisher:
Cengage Learning
Big Ideas Math A Bridge To Success Algebra 1: Stu…
Algebra
ISBN:
9781680331141
Author:
HOUGHTON MIFFLIN HARCOURT
Publisher:
Houghton Mifflin Harcourt

Algebra for College Students
Algebra
ISBN:
9781285195780
Author:
Jerome E. Kaufmann, Karen L. Schwitters
Publisher:
Cengage Learning

Linear Algebra: A Modern Introduction
Algebra
ISBN:
9781285463247
Author:
David Poole
Publisher:
Cengage Learning

Elementary Geometry For College Students, 7e
Geometry
ISBN:
9781337614085
Author:
Alexander, Daniel C.; Koeberlein, Geralyn M.
Publisher:
Cengage,