A retailer wants to see if a red "Sale" sign brings in more revenue than the same "Sale" sign in blue. The data below shows the revenue in thousands of dollars that was achieved for various days when the retailer decided to put the red "Sale" sign up and days when the retailer decided to put the blue "Sale" sign up. Red: 2.7, 2.6, 1.1, 4.2, 2.6, 3.4, 2.3, 2.9, 4, 2.6 Blue: 2.2, 1, 2.8, 1.6, 0.6, 0.9, 1, 1.7, 3.4 Assume that both populations follow a normal distribution. What can be concluded at the a = 0.01 level of significance level of significance? b. The test statistic (to) ✓ = (please show your answer to 3 decimal places.) c. The p-value = (Please show your answer to 4 decimal places.)
A retailer wants to see if a red "Sale" sign brings in more revenue than the same "Sale" sign in blue. The data below shows the revenue in thousands of dollars that was achieved for various days when the retailer decided to put the red "Sale" sign up and days when the retailer decided to put the blue "Sale" sign up. Red: 2.7, 2.6, 1.1, 4.2, 2.6, 3.4, 2.3, 2.9, 4, 2.6 Blue: 2.2, 1, 2.8, 1.6, 0.6, 0.9, 1, 1.7, 3.4 Assume that both populations follow a normal distribution. What can be concluded at the a = 0.01 level of significance level of significance? b. The test statistic (to) ✓ = (please show your answer to 3 decimal places.) c. The p-value = (Please show your answer to 4 decimal places.)

Glencoe Algebra 1, Student Edition, 9780079039897, 0079039898, 2018
18th Edition
ISBN:9780079039897
Author:Carter
Publisher:Carter
Chapter10: Statistics
Section10.6: Summarizing Categorical Data
Problem 10CYU

Related questions
Question
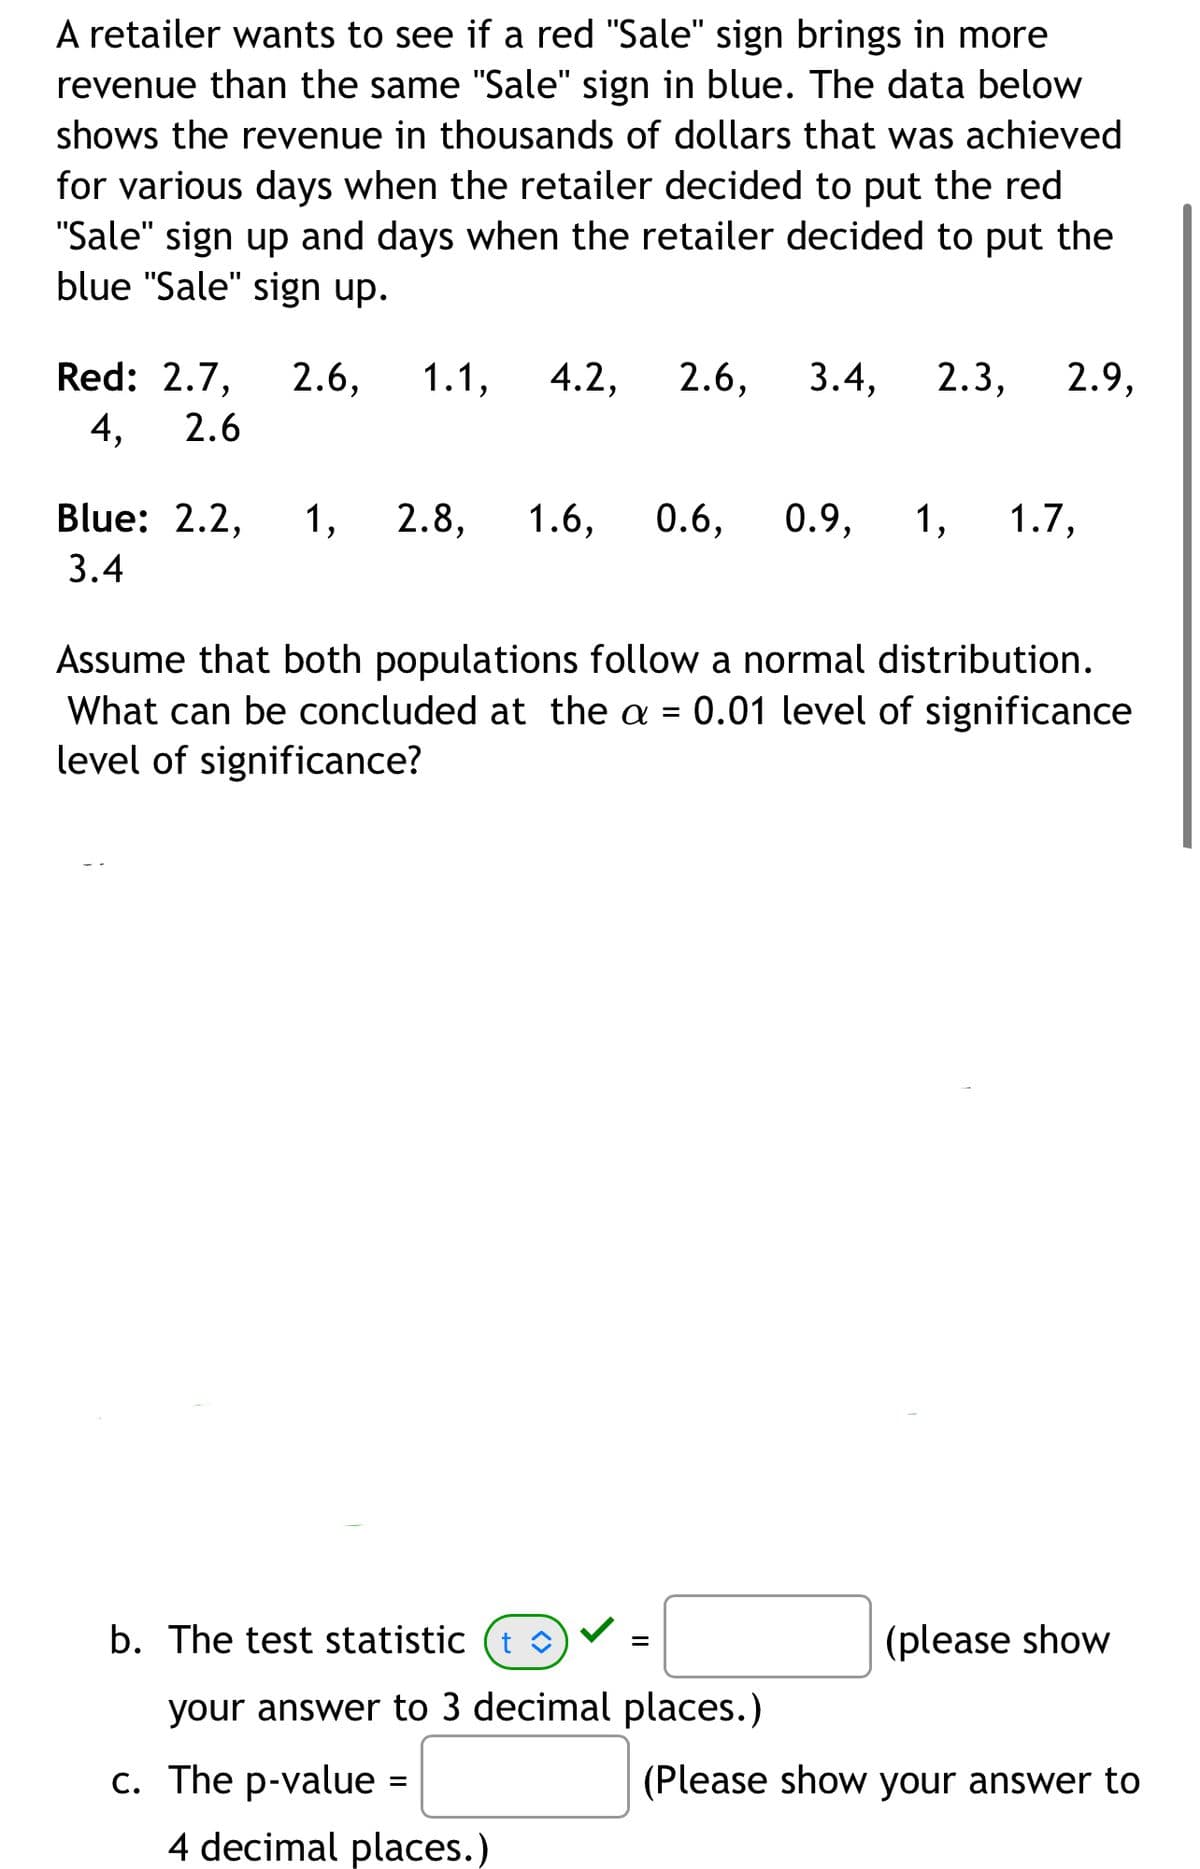
Transcribed Image Text:A retailer wants to see if a red "Sale" sign brings in more
revenue than the same "Sale" sign in blue. The data below
shows the revenue in thousands of dollars that was achieved
for various days when the retailer decided to put the red
"Sale" sign up and days when the retailer decided to put the
blue "Sale" sign up.
Red: 2.7, 2.6, 1.1, 4.2, 2.6, 3.4, 2.3, 2.9,
4, 2.6
Blue: 2.2, 1, 2.8, 1.6, 0.6, 0.9, 1, 1.7,
3.4
Assume that both populations follow a normal distribution.
What can be concluded at the a = 0.01 level of significance
level of significance?
b. The test statistic t î
=
(please show
your answer to 3 decimal places.)
c. The p-value =
(Please show your answer to
4 decimal places.)
Expert Solution
This question has been solved!
Explore an expertly crafted, step-by-step solution for a thorough understanding of key concepts.

Step by step
Solved in 2 steps with 2 images

Recommended textbooks for you
Glencoe Algebra 1, Student Edition, 9780079039897…
Algebra
ISBN:
9780079039897
Author:
Carter
Publisher:
McGraw Hill

Holt Mcdougal Larson Pre-algebra: Student Edition…
Algebra
ISBN:
9780547587776
Author:
HOLT MCDOUGAL
Publisher:
HOLT MCDOUGAL

Functions and Change: A Modeling Approach to Coll…
Algebra
ISBN:
9781337111348
Author:
Bruce Crauder, Benny Evans, Alan Noell
Publisher:
Cengage Learning
Glencoe Algebra 1, Student Edition, 9780079039897…
Algebra
ISBN:
9780079039897
Author:
Carter
Publisher:
McGraw Hill
Holt Mcdougal Larson Pre-algebra: Student Edition…
Algebra
ISBN:
9780547587776
Author:
HOLT MCDOUGAL
Publisher:
HOLT MCDOUGAL
Functions and Change: A Modeling Approach to Coll…
Algebra
ISBN:
9781337111348
Author:
Bruce Crauder, Benny Evans, Alan Noell
Publisher:
Cengage Learning